
This masked electrician scenario records a move from 142 clicks to 775 clicks per month across 6 months, while tracked conversions moved to 38 by the end of the reporting window. The decision-useful part is not the headline alone. The sequence began with indexation and architecture work, then moved into intent alignment, internal linking, entity cleanup, and gradual authority work. That order matters because the case is designed to show what was changed, what was measured, and where trade-offs appeared rather than implying that traffic growth can be copied mechanically.
Executive Summary
Context
The scenario represents an anonymized local electrician lead-generation site where the meaningful conversion is a call or quote request rather than an online checkout. The tracked market includes a high-value local query with 4,400 monthly searches in the source model, so the campaign is framed around competitive local intent instead of an easy low-volume term.
At month 1, the recorded baseline was 17,783 impressions, 142 clicks, average position 19.3, and CTR 0.8%. The interpretation in this case is straightforward: the site had search exposure, but a meaningful share of tracked queries sat around position 19, where visibility was limited. That same position 19 also provides a useful reference point for understanding why architecture and intent assignment were addressed before more content was added.
Two operating constraints shaped the work. Content production was limited, so publication volume could not be used as the default answer. The client also required that claims remain supportable, which meant editorial and schema changes had to stay inside the evidence available on the site rather than inventing awards, review totals, or superlatives.
The Challenge
The crawl and query mapping showed a concentration problem: the main service page was expected to carry many commercial and transactional intents while thinner supporting pages overlapped those same needs. That made it difficult to determine which URL should consistently represent a given electrician query, and the recorded average position remained near 19.
The local destination also existed but lacked enough internal support, so the architecture did not clearly separate local intent from broader service intent.
The prioritization decision
New-content volume was deliberately pushed behind cleanup. The early campaign focused on indexation, canonical decisions, redirects, template issues, and intent consolidation before authority work was expanded. The operating rule was to stabilize the pages that mattered first, then reinforce them. That meant the opening stage was judged on structural evidence rather than expecting immediate traffic acceleration.
Methodology
The case uses Search Console for query and position data, analytics for sessions and tracked conversions, and a third-party SEO tool for visibility and referring-domain context. Conversion value is modeled from tracked calls and quote requests rather than reconciled against closed-job CRM revenue.
Diagnosis before expansion
- Crawl and indexation triage: every important URL was mapped to a dominant intent so overlapping pages could be identified.
- Intent ownership: each priority query cluster was assigned one canonical destination, with local intent separated from broader service and commercial-research intent.
Execution sequence
Technical work ran across months 1 to 3. Content and intent alignment ran across months 2 to 4. Architecture and internal-linking work was revisited in months 2, 3, and 5, with the consolidation decision revisited in month 5. Entity and schema cleanup ran across months 3 to 5. Digital PR, citation work, and link recovery ran across months 4 to 6. Editorial QA started in month 1 and acted as a claim-boundary check throughout.
Timeline
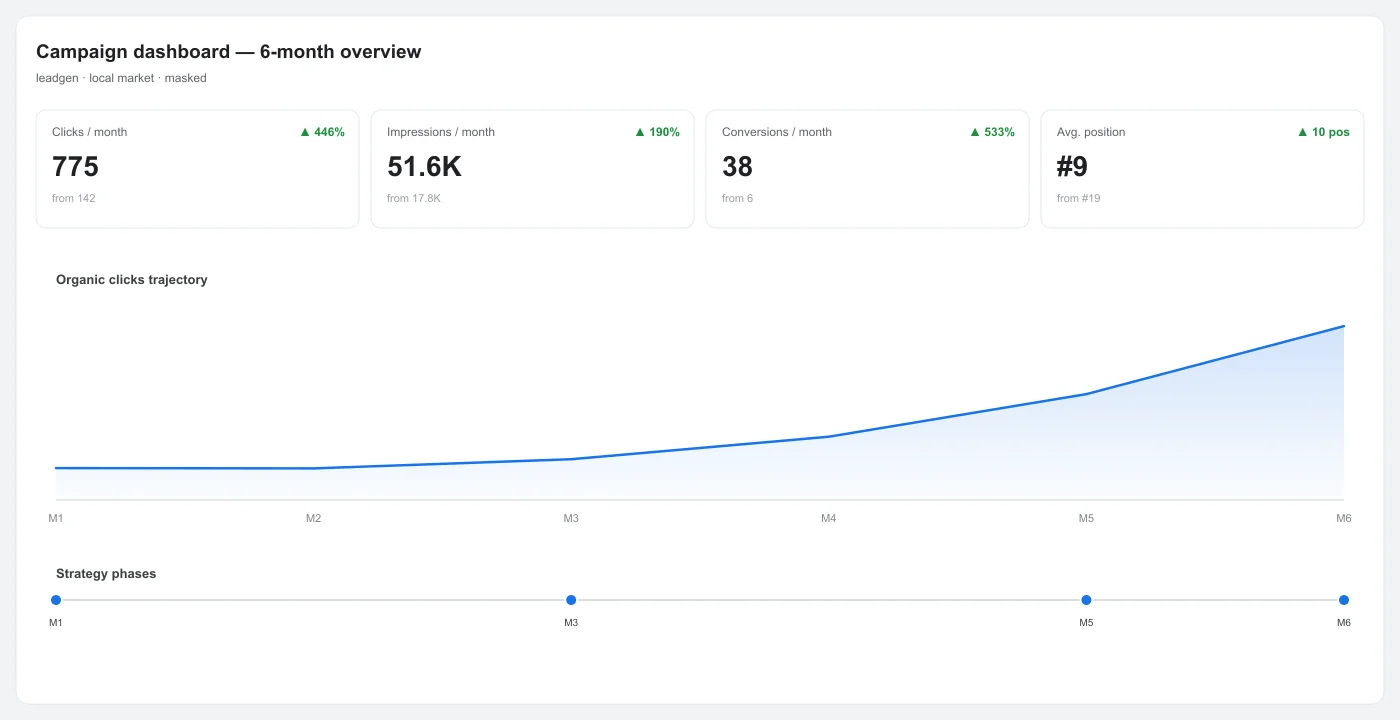
The workstreams were staged so changes could be interpreted against the sequence instead of being launched simultaneously.
Months 1 to 3: technical foundation
Crawl triage, canonical and redirect cleanup, duplication fixes, renderability checks, and indexation review came first. The recorded average position moved from 19.3 to 17.8 during the opening stage. That movement is an observation inside the modeled case, not proof that technical cleanup alone caused the change.
Months 2 to 4: content and intent alignment
Priority money-page sections and supporting content were rewritten around distinct intents so the site could answer cost, service, estimate, and local questions without creating unnecessary competing URLs.
Months 2, 3, 5: architecture and internal linking
Contextual links, hub relationships, orphan-page cleanup, and consolidation decisions were used to make the intended conversion pages easier to reach and easier to distinguish.
Months 3 to 5: entity and schema cleanup
Organization and Service markup was aligned with visible content and supportable business information. The objective was clearer machine-readable consistency, not a promise of ranking improvement or any special AI-search treatment.
Months 4 to 6: authority reinforcement
Lost-link recovery, citation reconciliation, and selective outreach came after the important pages were stabilized. Referring domains moved from 24 to 40, while the third-party domain-rating metric moved from 13 to 18 across the reporting window. The ending 13 reference is retained here only to make the original comparison explicit: the campaign did not treat a lower starting authority score as a reason to pursue an abrupt link spike.
Results
The recorded click trajectory was not linear. It moved from 142 to 182, then 282 in month 4, 472 in month 5, and 775 in month 6. The pattern is useful because it shows that the structural phase preceded the stronger traffic movement rather than arriving after it.
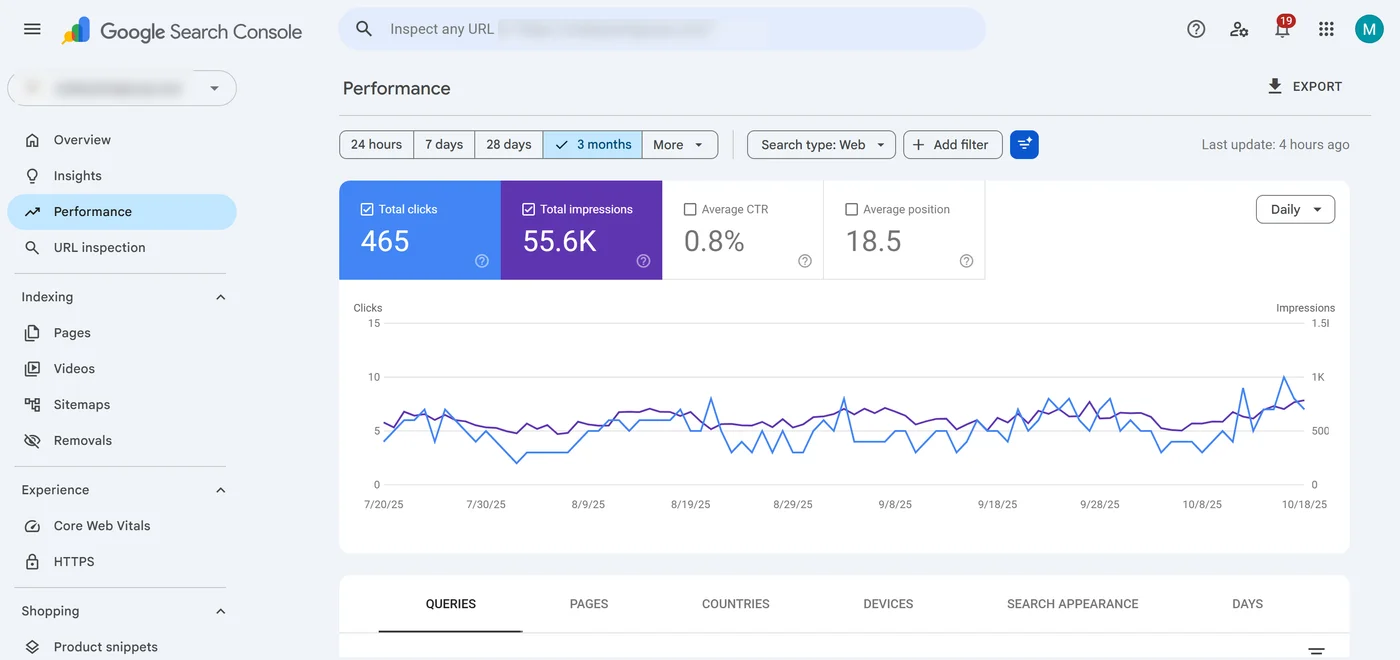
Month 1 baseline: 17,783 impressions, 142 clicks, average position 19.3, 6 tracked conversions, and roughly 2,040 in modeled value.
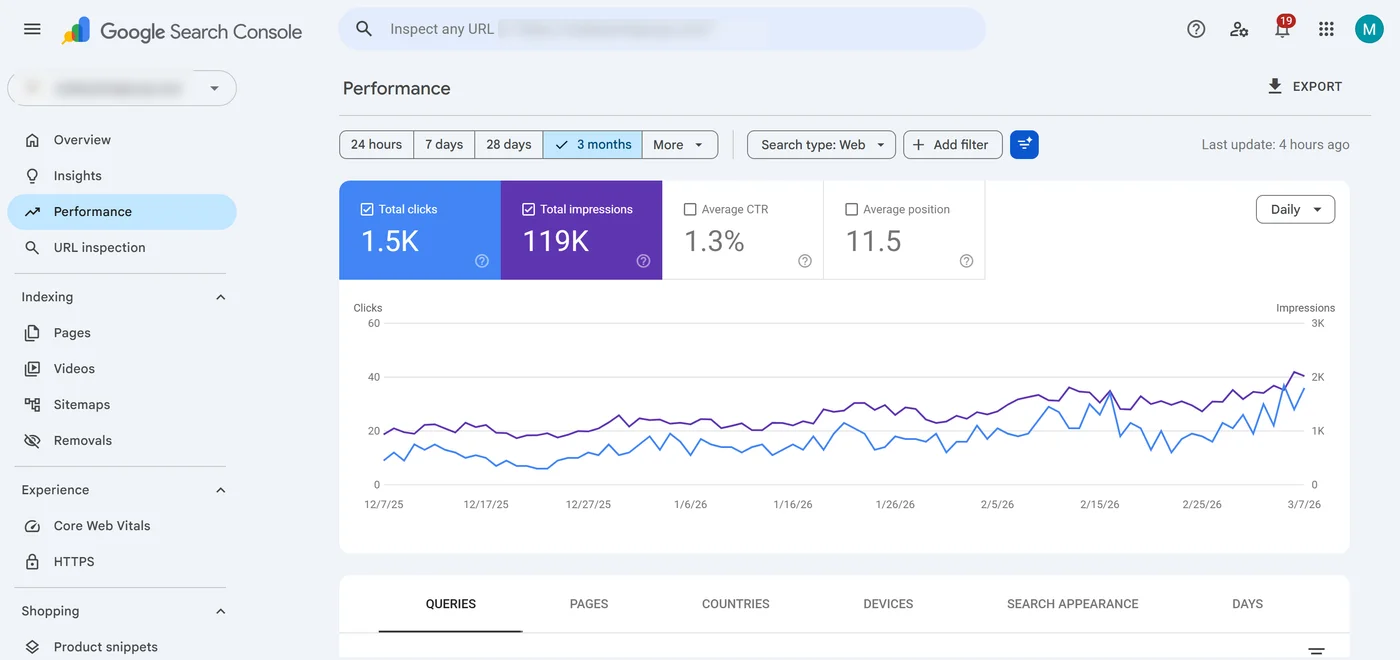
Month 6: 51,647 impressions, 775 clicks, average position 9.0, 38 conversions, and about 12,920 in modeled value. CTR moved from 0.8% to 1.5%, while average position moved from 19 to 9. Those metrics moved in a coherent direction, but the case should still be read as a masked synthetic scenario rather than independently verified client performance.
| Month | Impressions | Clicks | CTR | Avg position | Conversions | Modeled value |
|---|---|---|---|---|---|---|
| 1 | 17,783 | 142 | 0.8% | 19.3 | 6 | 2,040 |
| 2 | 17,636 | 141 | 0.8% | 18.5 | 6 | 2,040 |
| 3 | 20,192 | 182 | 0.9% | 17.8 | 8 | 2,720 |
| 4 | 28,233 | 282 | 1.0% | 15.3 | 14 | 4,760 |
| 5 | 39,347 | 472 | 1.2% | 12.1 | 23 | 7,820 |
| 6 | 51,647 | 775 | 1.5% | 9.0 | 38 | 12,920 |
Month 2 was essentially flat. In this scenario, that period coincided with URL cleanup and consolidation, so the decision was to keep evaluating whether the intended pages stabilized rather than interpret the temporary plateau as proof that the program had failed.
Authority Specialist · Our managed SEO service
Ready to turn the research into a plan?
Explore our Electrician SEO approach and review the scope, budget and terms before deciding.
No sales call required. Creating a workspace does not start a paid engagement.
Keyword Movement
The query set contains both gains and regressions, which makes it more useful for diagnosis than a winner-only table. The strongest recorded gains were attached to local and transactional intents after their destinations were clarified.
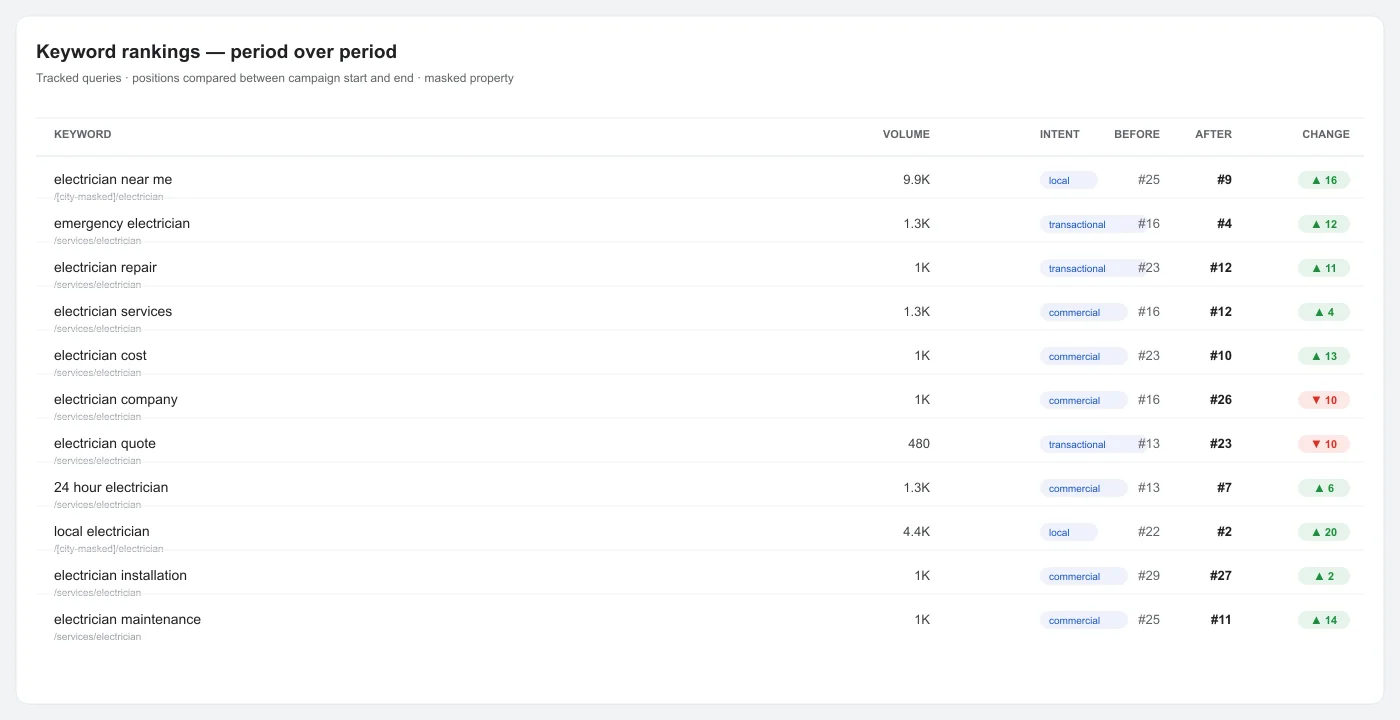
| Keyword | Volume | Intent | Mapped page | Before | After | Result |
|---|---|---|---|---|---|---|
| local electrician | 4,400 | local | /[city-masked]/electrician | 22 | 2 | Winner |
| electrician near me | 9,900 | local | /[city-masked]/electrician | 25 | 9 | Winner |
| emergency electrician | 1,300 | transactional | /services/electrician | 16 | 4 | Winner |
| 24 hour electrician | 1,300 | commercial | /services/electrician | 13 | 7 | Winner |
| affordable electrician | 320 | commercial | /services/electrician | 29 | 3 | Winner |
| electrician contractor | 210 | commercial | /services/electrician | 26 | 7 | Winner |
| electrician estimate | 480 | commercial | /services/electrician | 14 | 9 | Winner |
| electrician reviews | 320 | commercial | /services/electrician | 28 | 10 | Winner |
| electrician cost | 1,000 | commercial | /services/electrician | 23 | 10 | Winner |
| electrician maintenance | 1,000 | commercial | /services/electrician | 25 | 11 | Winner |
| electrician services | 1,300 | commercial | /services/electrician | 16 | 12 | Winner |
| electrician repair | 1,000 | transactional | /services/electrician | 23 | 12 | Volatile |
| electrician installation | 1,000 | commercial | /services/electrician | 29 | 27 | Stable |
| electrician quote | 480 | transactional | /services/electrician | 13 | 23 | Volatile (down) |
| electrician company | 1,000 | commercial | /services/electrician | 16 | 26 | Decliner |
| best electrician | 720 | commercial | /services/electrician | 15 | 31 | Decliner |
Local intent showed the largest recorded gains. The local query moved from 22 to 2, while the near-me query moved from 25 to 9. In this case, that movement followed consolidation of local intent onto the city page and stronger internal linking, but the sequence should be treated as an observed association inside the model rather than proof of a universal causal rule.
Several commercial terms improved together. Emergency electrician moved from 16 to 4, and affordable electrician moved from 29 to 3. Those gains aligned with the conversion-page focus, but they do not establish that any one optimization caused the result.
The regressions
Three tracked terms moved backward. The best-electrician term moved from 15 to 31, while electrician company moved from 16 to 26. The source scenario connects those declines with consolidation of thin standalone pages into the main services page. Electrician quote also moved from 13 to 23. Those losses matter because consolidation can improve focus on priority intent while weakening secondary intent, at least temporarily.
The trade-off was accepted because the site would not fabricate superlative proof or unsupported claims merely to pursue a query. That editorial boundary is part of the case, not a guarantee that the same decision would be correct on another site.
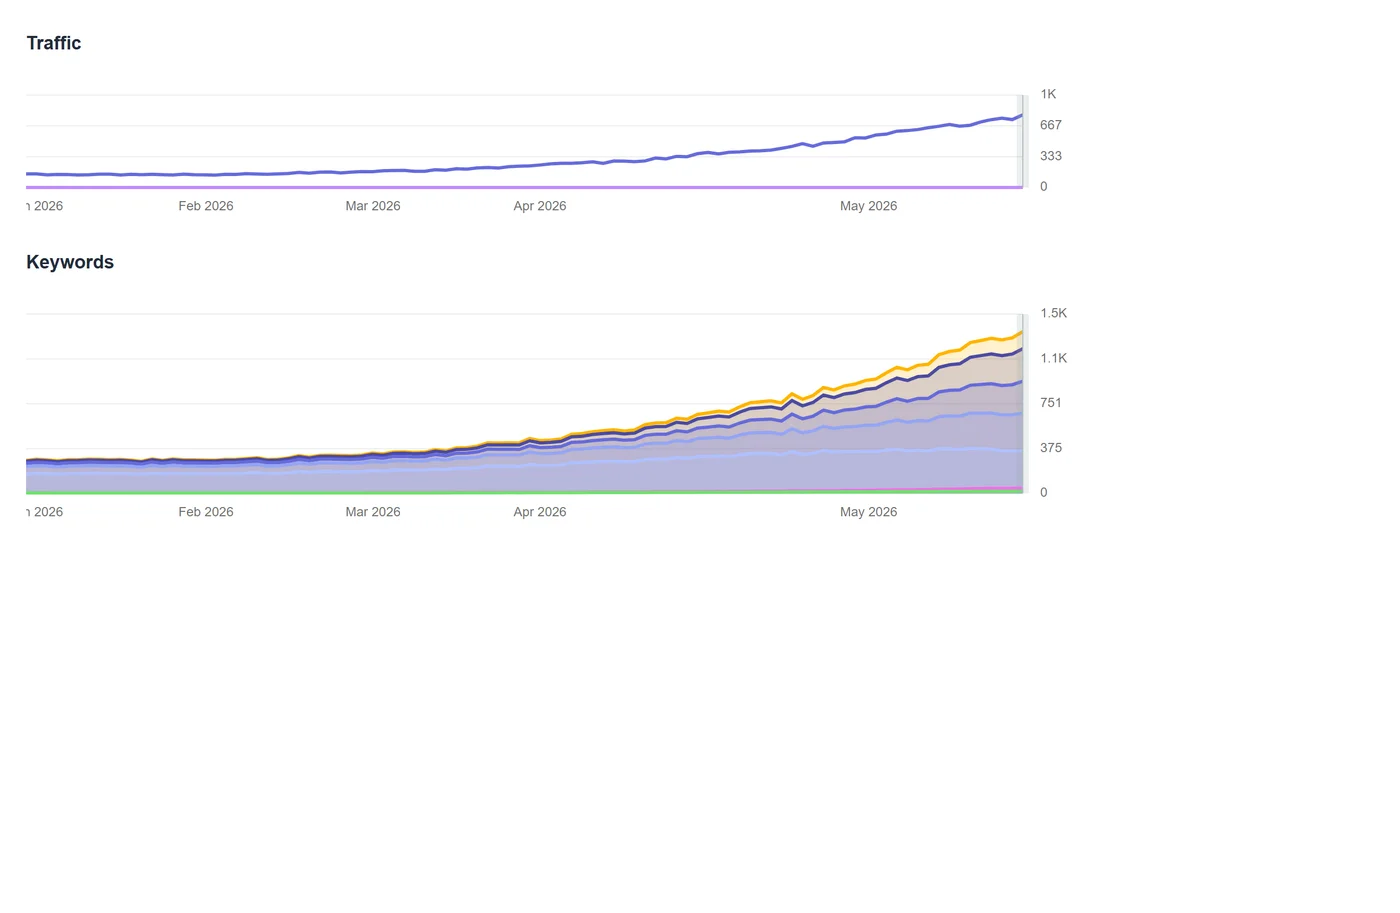
The third-party visibility view followed the same broad pattern as the Search Console data, with stronger movement appearing from month 4 after the earlier structural work.
Business Impact
Tracked conversions moved from 6 to 38 per month, a little over 6x, while clicks grew about 5.5x. That relationship is useful because conversion movement outpaced click growth inside the model, which is consistent with a larger share of traffic arriving on higher-intent pages. It should not be treated as proof that the same sequence will reproduce the same conversion pattern elsewhere.
Modeled monthly value moved from roughly 2,040 to 12,920. Those figures use an average-job-value model applied to tracked calls and quote requests. They are not reconciled closed revenue, so they should be interpreted as directional estimates rather than accounting results.
The timing also matters. The stronger movement in months 4 to 6 occurred after the structural and intent work had already been completed. If the program had been evaluated only at month 3, the later recorded acceleration would not yet have been visible.
Limitations
This is a masked synthetic case with internally coherent metrics, not a claim of independently audited client performance. Several limitations should stay attached to every interpretation.
- Modeled value is not verified revenue. The value figures come from tracked calls and quote requests multiplied by an average-job assumption.
- Some tracked terms declined. The recorded declines are part of the case and should not be hidden when discussing the overall result.
- Local visibility is variable. A reported average position such as 9 can move across devices, locations, and reporting periods.
- Authority work overlapped the end of the window. Work in month 4 through month 6 may have effects outside the recorded period, so the case cannot isolate a clean end-state for every intervention.
- The reporting window ends at month 6. The movement from 6 to 38 tracked conversions is meaningful within the scenario but still represents a relatively small absolute base.
How to Interpret the Sequence Without Overclaiming Cause
The case records a sequence of changes that moved together, but it does not provide an experimental design capable of proving which individual intervention caused each outcome.
Structure and intent alignment. The architecture work reduced ambiguity between competing URLs. The recorded baseline average position near 19 later moved to 17.8 by month 3 and then to 9.0 by month 6. That pattern is compatible with stronger ranking stability, but it should be described as an observed sequence rather than direct proof.
Visibility and click-through movement. As average position moved from 19 toward page-one territory, CTR moved from 0.8% to 1.5%. The recorded relationship is coherent, although CTR can also be affected by query mix, SERP features, brand familiarity, and snippet presentation.
High-intent query movement. Emergency electrician reached position 4, while affordable electrician reached position 3. Tracked conversions moved to 6x the starting level while clicks were about 5.5x the starting level. The case interprets that as a better intent mix, but the model does not isolate all contributing variables.
The consolidation pivot
The team used the emerging evidence to prioritize consolidated conversion pages over adding more overlapping URLs. The architecture work was revisited in month 5, and the stronger movement appeared across months 4, 5, and 6. The important lesson is the decision logic: when existing pages show stronger evidence than new production, shifting effort toward consolidation and reinforcement can be rational.
Key Takeaways
- Diagnose architecture before increasing publishing. The case began with a site whose average position sat near 19, so the first decision was to reduce overlap and stabilize important URLs.
- Authority work was gradual. Referring domains moved from 24 to 40, while the third-party domain-rating metric began at 13. The case did not rely on a sudden volume spike.
A masked electrician SEO case study focused on sequence, trade-offs, and measurable search movement rather than promises.
Electrician SEO That Starts With Diagnosis Before Expansion
This case study shows how a local electrician search program can be evaluated through architecture, intent alignment, technical accessibility, internal linking, supportable business information, and tracked enquiry movement.
It is a scenario for understanding decisions and evidence, not a guarantee of the same result for another contractor.
It is a scenario for understanding decisions and evidence, not a guarantee of the same result for another contractor.