
This masked scenario starts at 2,375 monthly clicks in month 1 and ends at 10,465 in month 12. Average position changes from 21.07 to 4.0, while modeled lead actions rise from 142 to 728 and modeled monthly lead value changes from $92,300 to $473,200. Those values are internally coherent scenario metrics, not verified client exports. The decision-useful part is the sequencing: clean indexation and intent ownership first, then expand authority, then evaluate whether new production is helping. The month-5 decision to pause expansion and consolidate weaker intent overlap is included because it shows how a campaign can change direction when the evidence no longer supports more publishing.
Executive Summary
Context
The scenario represents a local plumbing lead-generation site in a masked metro. The commercial architecture includes a primary service page at /services/plumber, a local page at /[city-masked]/plumber, and a small support-content layer. At baseline, average position sits around 21; some commercial queries are within reach while others sit beyond 50, and page ownership is unclear for several overlapping intents.
The modeled authority profile begins with Domain Rating 17, 41 referring domains, and 162 total backlinks. That starting point matters because the scenario does not assume a site with no authority at all. The operating constraints are equally important: established local competitors, a hard cap on monthly content production, and an explicit requirement to avoid unsupported claims in service and trust copy.
The business objective is lead generation rather than raw traffic. Rankings matter only when the query has meaningful plumbing-service intent and the destination page gives the searcher a clear next step. Informational traffic that does not support discovery, trust, or commercial intent is therefore secondary.
The Challenge
The first problem is commercial intent overlap. Queries such as plumber services, plumber cost, plumber pricing, plumber repair, and best plumber are all associated with /services/plumber, but the page tries to satisfy too many distinct expectations at once. Several modeled rankings sit in the 20s and 50s, suggesting weak intent ownership rather than one clean commercial target.
The second problem is indexation noise. Duplicate and low-value template URLs make it harder to see which pages should be treated as canonical. Until that layer is stabilized, content changes are harder to interpret because ranking movement can reflect indexation changes rather than content quality.
The third problem is local intent without enough support. The modeled query local plumber carries 6,600 search volume and sits at position 75, while plumber near me sits at 50. The local landing page exists, but the scenario assumes it is not yet reinforced strongly enough through internal architecture, clear service-area context, and broader business signals.
The practical constraint is production capacity. Creating more pages before clarifying canonicalization and intent ownership would increase the number of URLs competing for the same themes, so the plan prioritizes cleanup and page responsibility before expansion.
Methodology
The scenario uses six workstreams, but they are not treated as six independent ranking levers. The operating sequence is foundation, intent alignment, architecture, authority, and quality control, with overlap only where it does not make the underlying measurement harder to interpret.
Data sources
- Search-performance metrics are reviewed across the modeled 12-month window, including impressions, clicks, CTR, and average position.
- Analytics sessions and lead actions are tracked, with modeled conversions defined as quote, appointment, or consultation submissions.
- Authority indicators such as Domain Rating, referring domains, and total backlinks are sampled during the period.
- Keyword positions are compared before and after for the 16 commercially relevant tracked queries represented in the scenario.
Evidence boundary
The metrics are synthetic and masked. Revenue is a modeled lead value rather than booked revenue, and no CRM close-rate evidence is supplied. Average position is also a blended metric that can move with query mix and SERP volatility. The scenario therefore supports discussion of sequencing and internal coherence, not verified attribution.
Timeline
The timeline links each workstream to a specific operating purpose so the reader can distinguish foundation work from later growth work.
Months 1-3: Technical cleanup and indexation control
The first stage covers canonical review, redirects, template duplication, renderability, Core Web Vitals checks, and internal status-code validation. The purpose is to make the indexable set reflect the pages the site actually wants Google to evaluate. In the modeled data, average position changes from 21.07 to 17.69 during this stage. Brand Voice and editorial QA also begin in month 1 so later content is written inside defined claim boundaries.
Months 2-4: Commercial intent alignment
Once the indexation picture is cleaner, the money page is rewritten around the commercial sub-intents the site actually wants to own. The scenario keeps /services/plumber as the central commercial page and uses /resources/plumber-guide as support rather than creating informational pages with no relationship to a commercial destination.
Month 5: Consolidation instead of more production
By month 5, modeled evidence favors consolidation over additional publishing. Weak overlapping pages are merged or redirected, orphaned and low-value URLs are reviewed, and internal paths to priority conversion pages are shortened. Average position is shown at 14.51 in month 5 and 12.96 in month 6. The point is not that consolidation guarantees those moves, but that the campaign changes the intervention before judging the next stage.
Months 3-5: Entity and structured-data cleanup
Organization and Service schema, author and reviewer alignment, citation consistency, and answer-ready summaries are reviewed to reduce ambiguity. Structured data is treated as descriptive markup, not a guaranteed ranking mechanism.
Months 4-6 and 7: Authority reinforcement
The authority stage emphasizes lost-link recovery, relevant citation cleanup, unlinked mentions, and quality thresholds. Referring domains move from 55 in month 4 to 70 by month 7 in the synthetic data. The value of that pattern is its gradual shape; it should not be read as a recommended link quota.
Results
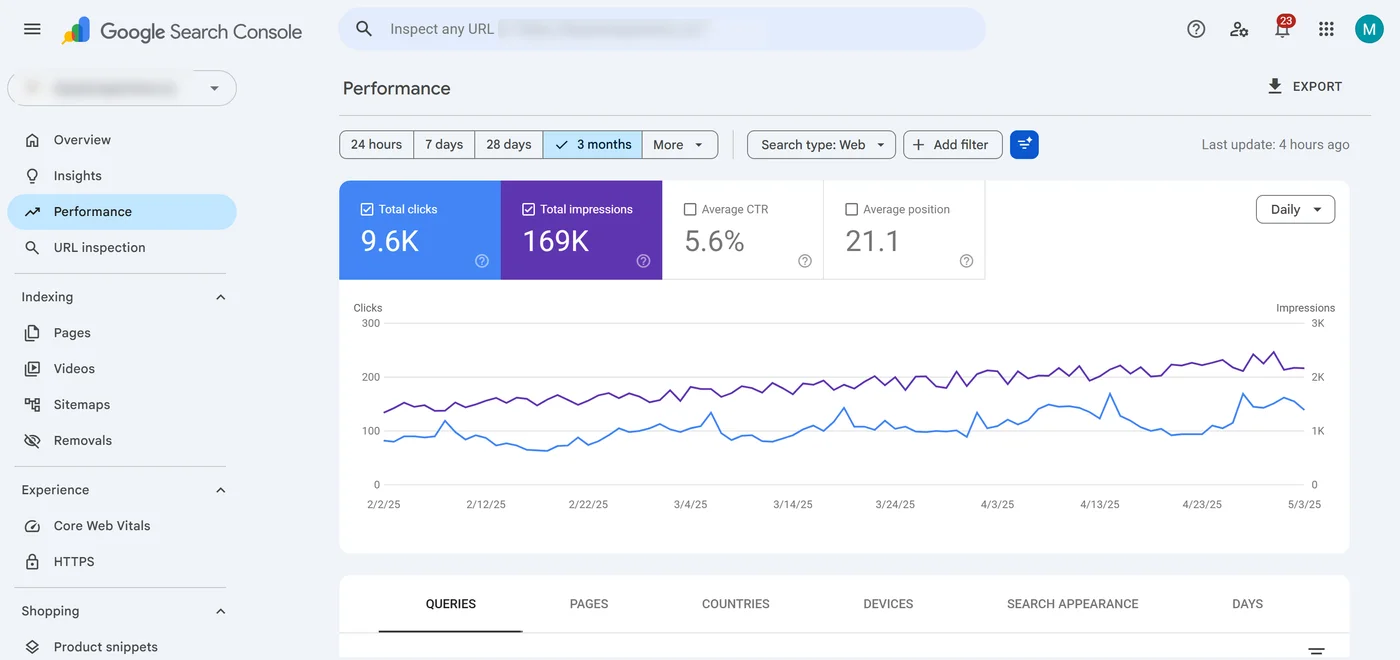
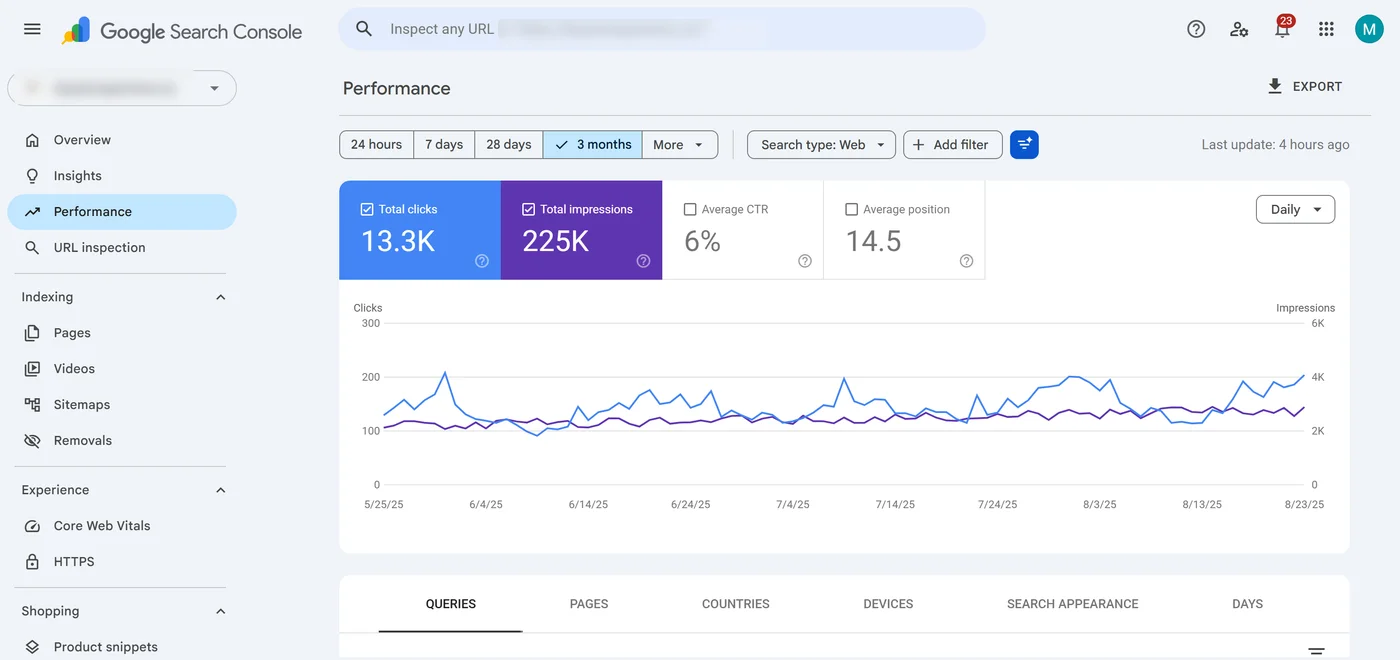
At the modeled starting point, month 1 records 42,403 impressions, 2,375 clicks, 5.6% CTR, average position 21.07, 142 lead actions, and modeled lead value of $92,300.
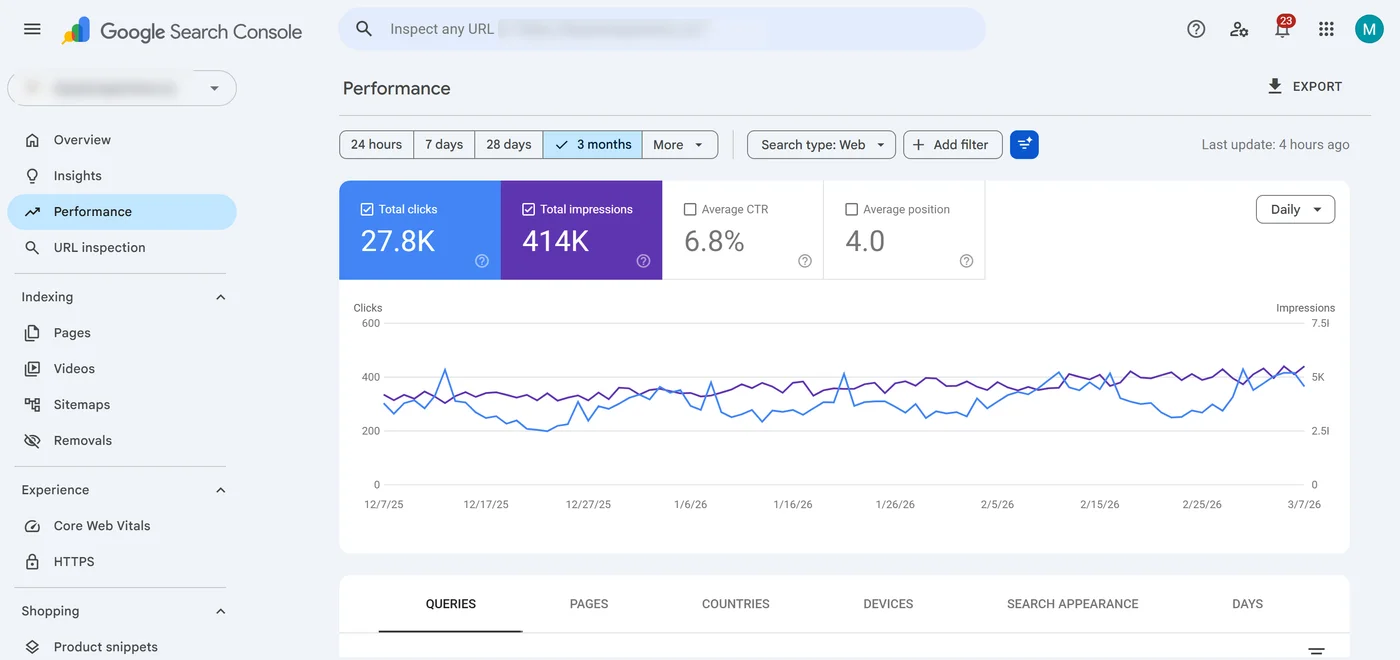
By month 12, the scenario records 153,902 impressions, 10,465 clicks, 6.8% CTR, average position 4.0, 728 lead actions, and modeled lead value of $473,200. The CTR change from 5.6% to 6.8% is directionally consistent with stronger placement and better query-page alignment, but the scenario does not prove which individual intervention caused the change.
Both visuals are masked illustrative views, not verified Google exports. The evidence policy below makes that boundary explicit. These metrics are coherent for scenario modeling and must not be represented as independently verified client results.
How the modeled curve changes
- Impressions increase from 42,403 to 153,902, showing broader modeled query exposure.
- Lead actions increase 5.1x from 142 to 728, while clicks increase 4.4x, which is internally consistent with a traffic mix that becomes more commercially focused.
- Domain Rating changes from 17 to 29 and referring domains from 41 to 96. Those authority metrics move alongside later gains, but the case study does not claim that they independently caused them.
Authority Specialist · Our managed SEO service
Ready to turn the research into a plan?
Explore our Plumber SEO approach and review the scope, budget and terms before deciding.
No sales call required. Creating a workspace does not start a paid engagement.
Keyword Movement
The table keeps both winners and regressions visible. That matters because a consolidation decision should be judged by the value of the query set it strengthens, not by pretending every tracked term improves.
| Keyword | Volume | Intent | Mapped page | Before | After | Category |
|---|---|---|---|---|---|---|
| plumber services | 1000 | commercial | /services/plumber | 37 | 1 | winner |
| plumber cost | 1000 | commercial | /services/plumber | 20 | 1 | winner |
| plumber repair | 480 | transactional | /services/plumber | 27 | 1 | winner |
| plumber guide | 1300 | informational | /resources/plumber-guide | 50 | 1 | winner |
| plumber pricing | 1900 | commercial | /services/plumber | 59 | 8 | winner |
| plumber near me | 880 | local | /[city-masked]/plumber | 50 | 10 | winner |
| best plumber | 320 | commercial | /services/plumber | 26 | 13 | winner |
| local plumber | 6600 | local | /[city-masked]/plumber | 75 | 35 | winner |
| plumber appointment | 480 | transactional | /services/plumber | 74 | 35 | winner |
| plumber reviews | 1000 | commercial | /services/plumber | 44 | 21 | volatile |
| plumber specialist | 1000 | commercial | /services/plumber | 78 | 27 | volatile |
| plumber consultation | 1900 | transactional | /services/plumber | 78 | 65 | winner |
| emergency plumber | 720 | transactional | /services/plumber | 64 | 55 | winner |
| plumber quote | 720 | transactional | /services/plumber | 36 | 38 | stable |
| plumber company | 210 | commercial | /services/plumber | 43 | 50 | decliner |
| plumber service area | 590 | local | /[city-masked]/plumber | 77 | 93 | decliner |
Where the modeled gains concentrate
The strongest movement appears around commercial terms mapped to the consolidated service page. plumber cost, plumber pricing, plumber services, and plumber repair finish in positions 1-8 in the scenario. That pattern is consistent with stronger intent ownership after the month-5 consolidation, but it remains an illustration rather than proof that consolidation alone caused each move.
The larger local term local plumber has modeled volume 6,600 and moves from 75 to 35. That is useful because it shows a high-value term improving without being forced into a page-one success story.
Where the scenario gives up ground
plumber company moves from 43 to 50, while plumber service area moves from 77 to 93. The scenario interprets both as acceptable losses after concentrating the primary pages around higher-value commercial and local intents. plumber quote changes from 36 to 38, which is small enough that it should not be over-interpreted without more query-level evidence.
Business Impact
Because this is a lead-generation scenario, the central business metric is modeled lead volume rather than traffic alone. Lead actions move from 142 to 728 per month, a 5.1x increase, while sessions move from 2,345 to 10,208. The modeled conversion rate remains around 6%, which keeps the scenario internally consistent with traffic becoming larger without requiring an implausible conversion-rate spike.
Modeled lead value changes from $92,300 to $473,200 per month. That number is not booked revenue. It is a scenario model based on lead actions multiplied by an assumed average lead value, with no supplied CRM close-rate data. The defensible conclusion is therefore about modeled qualified-lead volume, not cash collected.
The commercial explanation is the modeled 5x lead-value direction and, more importantly, intent mix. Queries finishing in modeled positions 1-8 include cost, pricing, services, and repair terms, while other tracked commercial queries begin in ranges such as 20-60. The scenario is designed to show why a plumbing campaign should distinguish commercially useful visibility from broad informational growth rather than assuming every additional click has equal business value.
Limitations
The modeled curve is intentionally not perfectly smooth.
- Month 7 softens. Clicks move from 6,103 to 5,980 and impressions from 98,428 to 94,914 between months 6 and 7. Average position is modeled as continuing to improve, so the scenario treats demand mix and SERP volatility as plausible explanations rather than declaring a campaign failure.
- Month 10 is also softer. Impressions move from 126,542 to 119,395 and clicks from 8,225 to 7,880 versus month 9. Lead actions move from 546 to 550. Domain Rating is modeled at 26 through this period, but the case study does not claim that the plateau caused the traffic change.
- Revenue is modeled. The dollar values are not invoiced revenue because CRM close-rate evidence is not present.
- Average position is blended. Query mix and SERP changes can affect month-to-month movement, so the longer trend is more useful than an isolated checkpoint.
- Some queries regress. The scenario keeps those losses visible rather than filtering them out of the result set.
- The broader curve resumes by month 11, while local competition remains a constraint. The modeled local plumber result finishes at 35, not page one, which is more decision-useful than inventing a complete sweep of the SERP.
Causal Explanation
The safest way to read the scenario is as a sequence of hypotheses and observations, not as proof that one intervention mechanically caused the next metric.
Step 1: stabilize indexation. Canonical, redirect, and template cleanup are handled first so later changes are measured against a cleaner indexable set. Across months 1-3, average position changes from 21.07 to 17.69. That is consistent with stabilization, but the synthetic dataset cannot isolate a causal contribution for each technical fix.
Step 2: concentrate commercial intent. In month 5, the service architecture is consolidated around the strongest commercial themes. Several modeled commercial queries later finish in the top 8, but the correct interpretation is that page ownership and relevance become more coherent, not that consolidation guarantees those exact rankings.
Step 3: placement and CTR move together. Average position changes from 21 to 4, while CTR changes from 5.6% to 6.8%. That direction is plausible because stronger placement can affect click opportunity, but snippets, brand recognition, query mix, and SERP features can also influence CTR.
Step 4: commercially aligned traffic supports more lead actions. Modeled sessions grow while conversion rate stays near 6%, and clicks increase about 4x as lead actions move from 142 to 728. The scenario uses this to illustrate why intent quality should be tracked alongside traffic quantity.
Step 5: authority develops later. Domain Rating changes from 17 to 29 and referring domains from 41 to 96. The month-10 authority plateau is noted because it prevents the narrative from crediting every later gain to link growth. Authority is one supporting variable among several, not a guaranteed engine.
Key Takeaways
- Clean the indexable set before scaling production. If canonical ownership is unclear, more pages can make measurement and page responsibility harder.
- Use consolidation when commercial intent is colliding. In the modeled month 5 pivot, the campaign stops adding volume and strengthens existing commercial pages instead; several tracked terms later finish in the top 8.
- Decide which intents are strategically secondary. Not every tracked query needs to win if strengthening it would weaken a more valuable page or reintroduce overlap.
- Do not turn authority metrics into a quota. The month-10 plateau is retained precisely because clean measurement is more useful than forcing a perfectly rising curve.
- Report commercial outcomes separately from visibility. The modeled click gain is 4.4x, while modeled lead actions increase 5.1x. That difference is why query intent and conversion behavior need their own reporting.
Own Your Exclusive Lead Flow
Stop Paying for Shared service
Build an organic search system that helps prospective plumbing customers discover relevant service pages, understand where the business operates, and contact the company directly without representing modeled case-study performance as a guaranteed outcome.