
In this representative example, when the engagement started, the financial advisor site sat at an average position around 24.7 and pulled just 209 non-branded clicks and 6 conversions in month one. Twelve months later the same site returned 1,572 clicks, 74 conversions, and an average position of 6. The lever was not more content for its own sake. It was resolving cannibalization on the money pages first, then building a deep informational library across the topic clusters that fed link equity and topical authority into the pages that actually book consultations.
Executive Summary
Starting Position
The scenario represents a local financial advisory practice running a lead generation site (contact forms, consultation bookings, and phone calls are the money events).
The starting picture was a familiar one for local finance. Average positions hovered near 25, which means the site was technically indexed for its commercial terms but almost never visible on page one. Non-branded traffic was uneven month to month. Topical coverage was thin: a handful of service pages, no supporting informational depth, and no clear architecture connecting the two. In a market where trust is the whole sale, the site gave Google very little reason to treat it as an authority.
The constraints were explicit from the start: strong local competition, a capped content production budget, and a hard rule against unsupported claims (this is regulated advice, so every statement had to stay within what the approved evidence supports). SEO copy cannot guarantee compliance, and responsible legal or regulatory reviewers remain required for applicable claims, disclosures, and jurisdiction-specific obligations.
What Needed Fixing
The audit surfaced three problems, and they were deliberately sequenced rather than attacked all at once.
Intent collisions on the money pages. Multiple commercial queries were all mapped to /services/financial-advisor, but so were near-duplicate variants and a couple of thin support pages targeting the same intent. Google was rotating which URL it ranked, so positions were unstable and no single page accumulated authority.
No topical foundation. The commercial pages were asking to rank for competitive terms (difficulty 42 to 48) with almost nothing behind them: no informational cluster, no internal links from relevant supporting content, no evidence the site understood the subject deeply. That is a weak position against established local competitors.
Trust and claim risk. Because this is financial advice, sloppy or unverifiable claims were both a compliance problem and an E-E-A-T problem. Anything published had to be reviewable against approved documentation before it went live.
The decision that shaped the whole engagement: fix structure and consolidate intent before scaling content, then use informational depth to lift the money pages rather than trying to muscle them up with links alone.
Work Sequence
Six workstreams ran across the year, staged so each one built on the last.
1. Technical SEO and indexation cleanup (months 1 to 3)
Crawl and indexation triage ran first, then canonicals and redirects were cleaned up, template-level duplication was fixed, and Core Web Vitals and status codes were validated. The goal was not a vanity technical score. It was to stop crawl waste on low-value URLs and give the priority templates a clean, stable foundation before a single new article shipped.
2. Information architecture and internal linking (months 2, 3, 5)
The site was mapped into a hub-and-spoke model, the duplicate commercial intent was consolidated into one money page, and the rest was redirected. Anchor text was redistributed toward the consolidated targets, the path to conversion pages was shortened, and orphaned or weak pages were pruned. This is the plumbing that lets topical authority flow from informational content into money pages.
3. Authority content and intent alignment (months 2 to 4)
This is the core of the story. The program built 59 articles across 8 topic clusters, structured so informational depth reinforced the commercial pages. Realistic clusters for a financial advisory practice look like: retirement and pension planning, investment basics, tax-efficient saving, fees and cost transparency, choosing an advisor, insurance and protection, estate and inheritance planning, and local/regulatory guidance. Each cluster answered genuine questions and linked contextually into the relevant money page.
The mechanism matters: a large, well-organized body of informational content earns topical authority and internal-link equity, and that is what lifts the commercial pages. Content is the cause; the ranking gains on the money pages are the effect. Over the year the tracked topical authority index climbed from 18 to 57, and the site ended covering roughly 1,055 informational keywords. That breadth is what tells search engines the site genuinely understands the subject, not just its transactional terms.
4. Entity, schema and AI presence (months 3 to 5)
Organization and Service schema were cleaned up, author and reviewer entities aligned, citation consistency checked, and answer-ready summary blocks written to be quotable, without adding any claim the page could not support. The intent was to make the brand's entity unambiguous across search and AI answer surfaces.
5. Digital PR and link recovery (months 4 to 6)
Referring domains grew from 37 to 68 and Domain Rating from 12 to 24 over the year. Lost links were recovered, citations cleaned, and relevant industry resource placements pursued, with a quality threshold before anything went live. Growth stayed inside plausible monthly caps rather than spiking unnaturally.
6. Brand voice and editorial QA (months 1, 2, 4)
Every draft ran through a reviewer checklist built from approved pages, so tone stayed consistent and risky language was blocked before publication. In a regulated niche, this is not overhead; it is what keeps the content publishable.
Data sources: modeled Search Console data for clicks, impressions, CTR, and position; modeled analytics for sessions and conversions; a third-party tool view for Domain Rating, referring domains, and visibility. Conversion-to-revenue uses an average client value model, not exact CRM close data.
Stage-by-Stage Timeline
Months 1 to 3 (foundation). Technical cleanup and intent mapping dominated. Clicks moved modestly (209 to 292) and average position tightened from 24.7 to 21.4. This phase does not produce dramatic traffic; it removes the structural reasons the site could not rank. Impressions grew from 23,189 to 32,395 as cleaner indexation exposed more queries.
Month 4 (content momentum). With the architecture consolidated, the first authority articles started to bite. Clicks reached 339, conversions hit 13, and average position crossed into the high teens (19.6). Fifteen articles were live by this point.
Month 5 (the pivot). Here the program changed course. Impressions actually dipped (33,879 down to 26,460) even as clicks held at 339 and CTR improved to 1.3%. Read plainly: the site was shedding low-value impressions and keeping the qualified ones. The program stopped chasing raw content volume and reinforced the pages that convert, pruning weak pages and consolidating overlapping ones. The higher CTR on lower impressions confirmed the traffic mix was getting healthier, not thinner.
Months 6 to 7 (authority reinforcement). Light digital PR and link recovery ran alongside continued cluster building. Average position pushed under 16, clicks climbed to 361, and conversions stabilized around 13. This is the patient middle of the engagement where authority compounds quietly.
Months 8 to 9 (breakout). The compounding effect showed. Clicks jumped from 361 to 605, conversions from 13 to 32, and average position fell from 15.5 to 11.5. The informational library (35 to 41 articles) was now old enough to carry real link equity into the money pages.
Months 10 to 12 (page-one economics). Average position reached 6, CTR climbed to 2.7%, and clicks hit 1,572 in the final month. Conversions closed the year at 74 against 6 at the start. By month 12 the content program stood at 59 articles and a topical authority index of 57.
Measured Results
The clearest way to read the change is the representative before-and-after Search Console view.
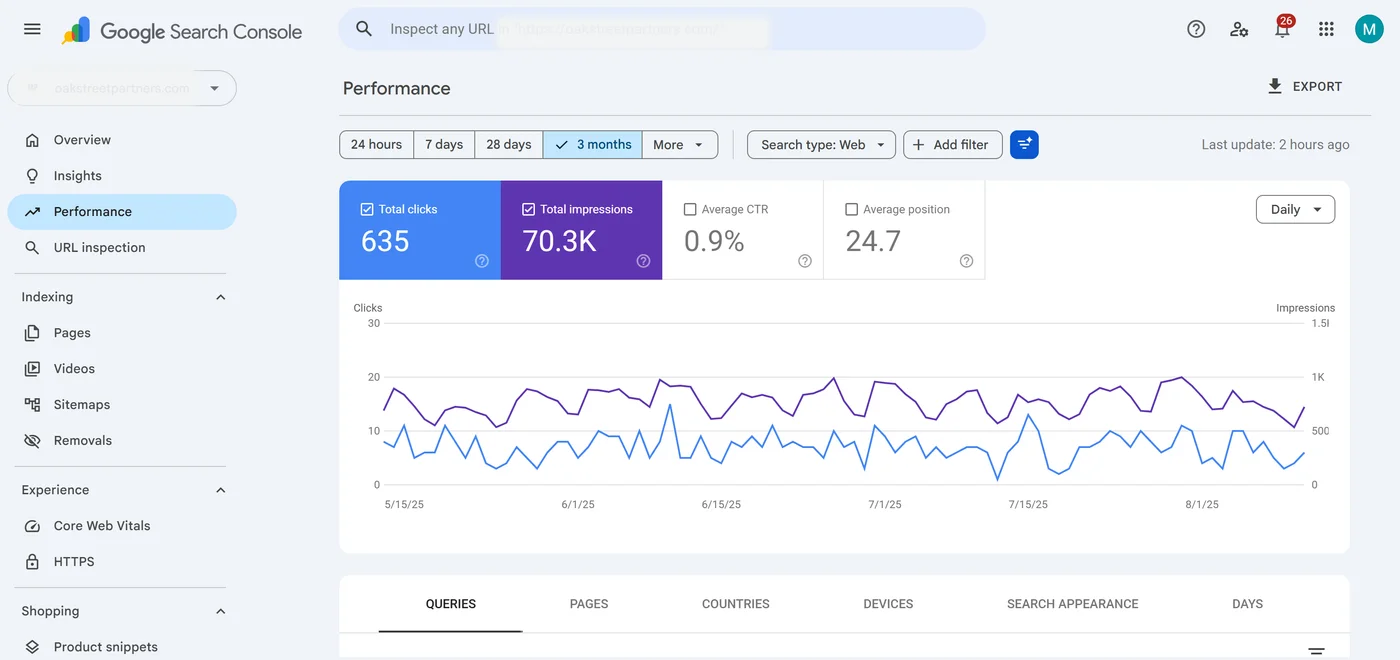
Month one: 23,189 impressions, 209 clicks, 0.9% CTR, average position 24.7. The site was present but effectively invisible on the queries that matter.
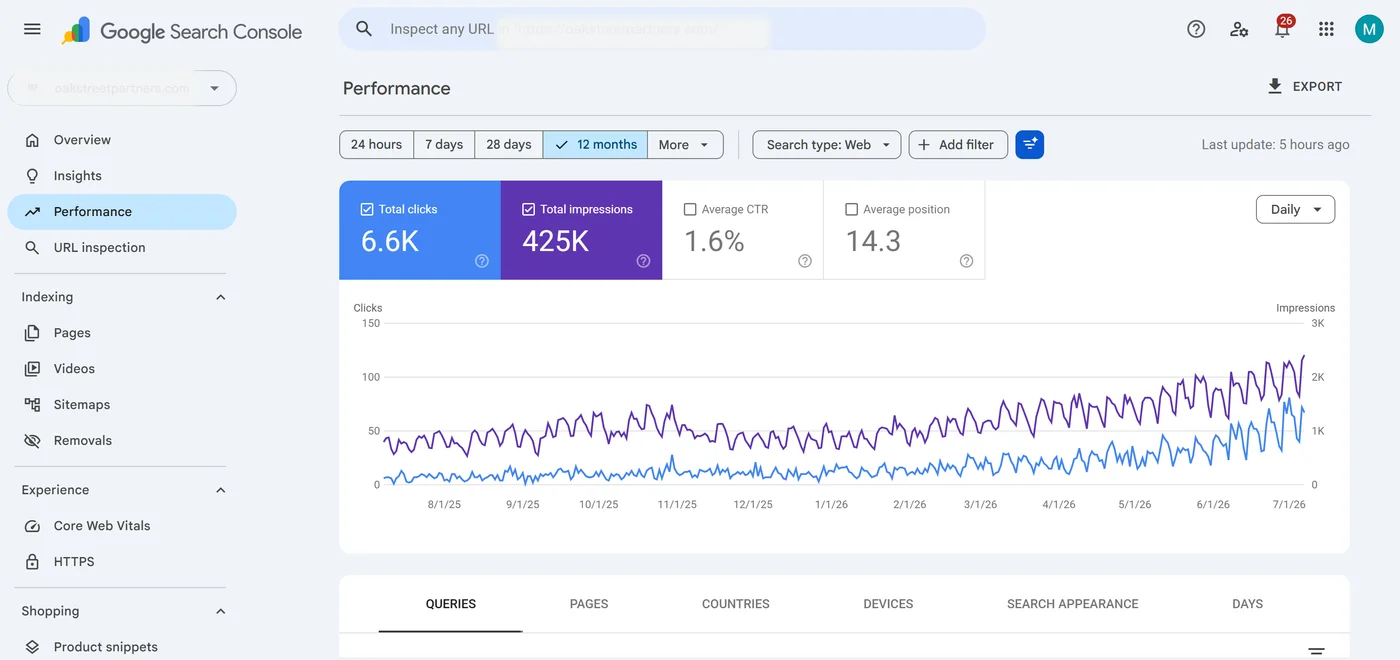
Month twelve: 58,230 impressions, 1,572 clicks, 2.7% CTR, average position 6. Impressions grew about 2.5x, but clicks grew roughly 7.5x, because the same visibility now sat far higher on the page where clicks actually happen.
The full trajectory: clicks 209 to 1,572, conversions 6 to 74, and modeled revenue 3,300 to 40,700 per month using an average client value. Sessions tracked the same curve, from 183 to 1,502. As a note on presentation, these figures are a representative example of the modeled engagement.
The CTR story is the part we are proudest of. A jump from 0.9% to 2.7% at scale is not a cosmetic gain; it reflects both higher positions and titles/descriptions that matched intent, so more of a larger impression base turned into qualified visits.
Keyword Movement
The commercial and transactional terms mapped to the consolidated money page were the big movers. Once cannibalization was resolved and the informational clusters fed authority into a single URL, the high-value queries climbed together rather than fighting each other.
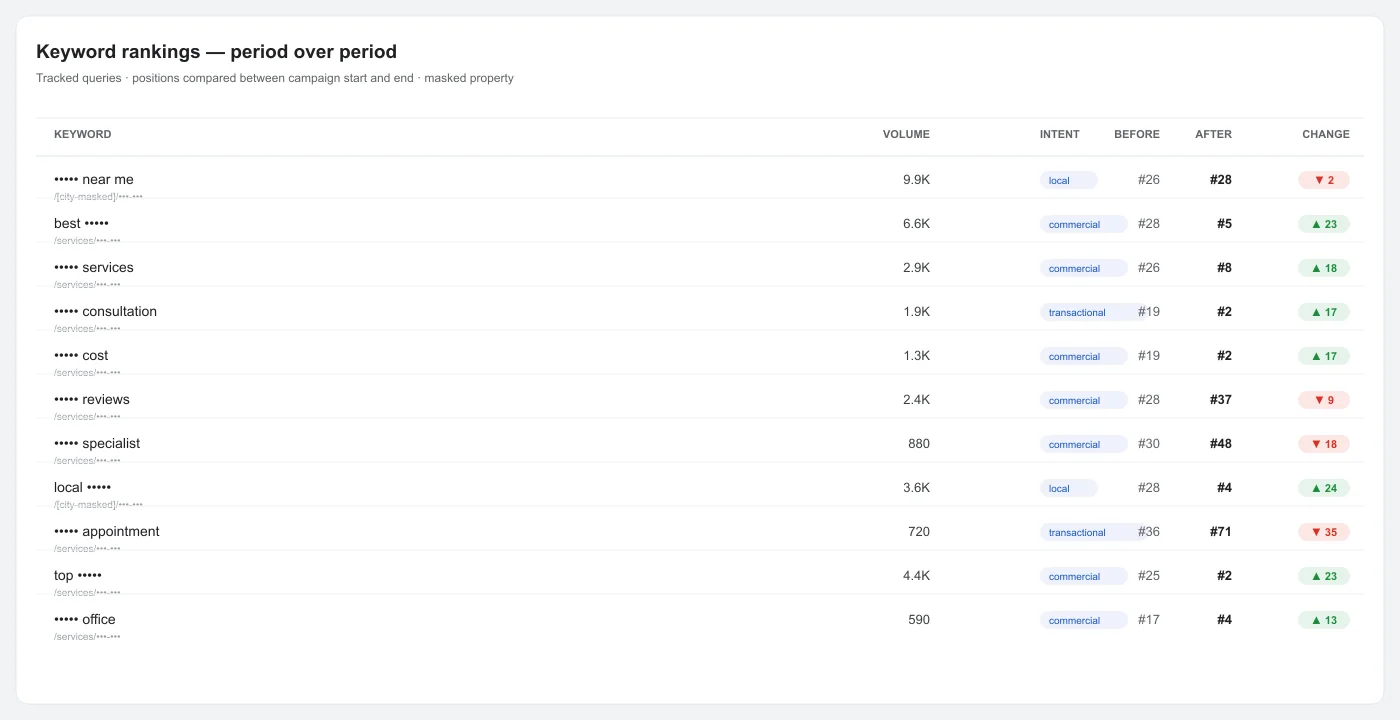
Commercial comparison terms (the 'best •••' and 'top •••' family) moved from the high 20s into the top five. Transactional intent (consultation-type queries) reached position 2. High-intent local queries ('local •••' and 'near me open now') moved onto page one, which for a local practice is where phone calls originate.
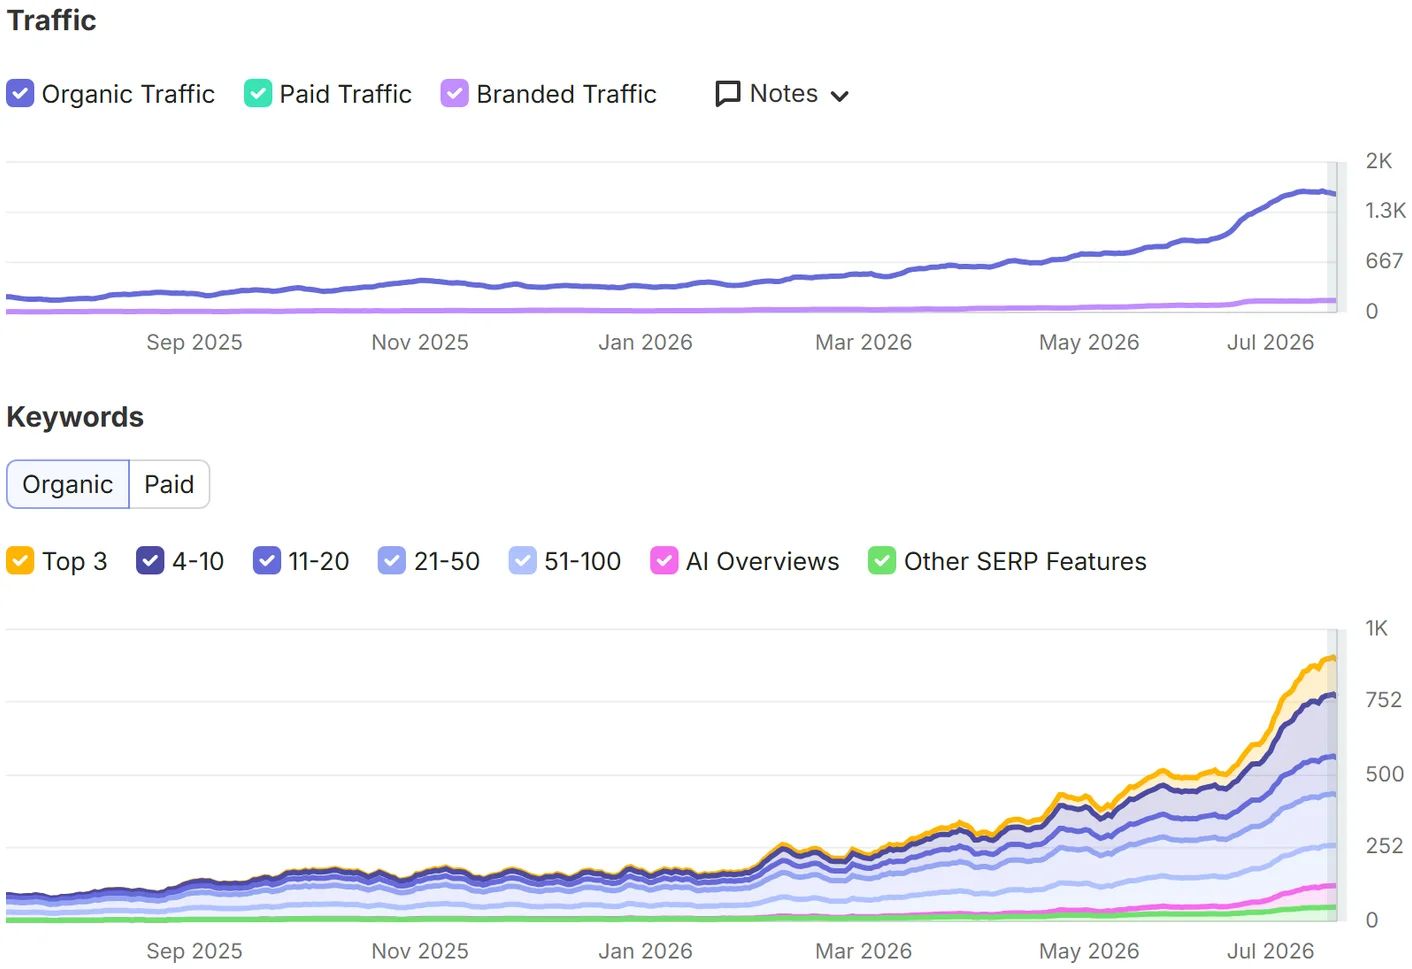
The representative third-party visibility and organic traffic view shows the same compounding curve: gradual through the foundation phase, then steepening from month 8 as topical authority matured.
| Query structure | Intent | Volume | Difficulty | Before | After |
|---|---|---|---|---|---|
| best ••• | Commercial | 6,600 | 48 | 28 | 5 |
| top ••• | Commercial | 4,400 | 46 | 25 | 2 |
| ••• services | Commercial | 2,900 | 38 | 26 | 8 |
| ••• consultation | Transactional | 1,900 | 35 | 19 | 2 |
| ••• cost | Commercial | 1,300 | 32 | 19 | 2 |
| ••• fees | Commercial | 1,600 | 33 | 30 | 4 |
| affordable ••• | Commercial | 1,000 | 34 | 29 | 2 |
| ••• experts | Commercial | 480 | 37 | 37 | 8 |
| ••• office | Commercial | 590 | 26 | 17 | 4 |
| local ••• | Local | 3,600 | 39 | 28 | 4 |
| ••• near me open now | Local | 320 | 25 | 42 | 3 |
| ••• guide | Informational | 590 | 29 | 35 | 6 |
| ••• near me | Local | 9,900 | 42 | 26 | 28 |
| ••• reviews | Commercial | 2,400 | 40 | 28 | 37 |
| ••• specialist | Commercial | 880 | 36 | 30 | 48 |
| ••• appointment | Transactional | 720 | 28 | 36 | 71 |
The honest losers
Three queries went backwards, and the case does not paper over them. The 'reviews' term slid from 28 to 37: this intent wants third-party review aggregators, and the practice's own page could not honestly manufacture review volume without breaching the no-fake-claims rule, so a weaker position was accepted rather than faked. The 'specialist' term dropped from 30 to 48, largely because overlapping commercial pages were consolidated and this variant lost its dedicated URL in the merge; it was a deliberate trade to strengthen the primary money page. The 'appointment' transactional term is genuinely volatile (it fell from 36 to 71), a low-volume query where the SERP kept swapping between booking widgets and directories. The program chose not to chase it at the cost of higher-volume transactional wins like the consultation term, which reached position 2.
The biggest-volume local term ('near me', 9,900 searches) stayed essentially flat (26 to 28). This is a saturated map-pack query where organic position is capped by local pack dominance; moving it needs sustained local signals (reviews, proximity, citations) beyond what this engagement prioritized.
Business Impact
Traffic is not the point; qualified leads are. Conversions rose from 6 to 74 per month, and modeled monthly revenue from roughly 3,300 to 40,700 on an average client value basis. Because these are financial advisory leads, each converted consultation carries meaningful lifetime value, which is why success was measured in bookings rather than sessions.
The informational content did more than rank for its own keywords. A person reading a cluster page on advisor fees or how to choose an advisor is a warm future buyer: they arrive with a question, the content answers it inside approved claim boundaries, and the internal links route them toward a consultation when they are ready. That is qualified, down-funnel traffic, not vanity volume. The 1,055 informational keywords the site ended up ranking for form a wide top of funnel that keeps feeding the money pages.
The durability point is the one we stress to every client. These rankings are an asset, not a rental. Paid search stops the moment the budget stops; the topical authority built here (index 18 to 57 across 8 clusters, backed by 68 referring domains) keeps compounding. Month 12 was the strongest month precisely because the content had aged into authority, and that momentum does not reset at renewal.
There is an emerging benefit that deserves careful framing because it cannot be precisely measured yet. Deep, well-structured, entity-clean content also raises the odds the brand is surfaced and cited by AI assistants and Google AI Overviews when people ask for the best advisor in the category. The answer-ready summary blocks and clean schema were built partly for this. Few local competitors have this depth yet, so early movers hold a real authority moat. This is presented as a modeled expectation rather than a precise citation count.
Limitations
Several things did not move cleanly, and the methodology has boundaries worth stating.
- Attribution lag and modeling. Revenue uses an average client value model, not exact CRM close data, which is masked.
- Month 5 impression dip. Impressions fell during the pivot. This was intended (low-value pages were pruned), but it means anyone reading the raw impression line in isolation would misread month 5 as a setback when CTR and conversion quality were improving.
- The 'near me' ceiling. The highest-volume local term barely moved because organic position is structurally capped under the local pack. Real gains there need a dedicated local/reviews program.
- Volatile low-volume terms. The 'appointment' query swung on SERP composition outside the program's control. It was deprioritized deliberately.
- Competitive response. Local finance competitors react. The month 8 to 12 gains held through the engagement, but rankings this good require maintenance, not a one-time push.
Disclosure: this is an anonymized composite case study. Client, domain, city, raw queries, and exact revenue are withheld, and the visuals are representative of the modeled engagement rather than real third-party data exports.
Causal Explanation
It is worth tracing exactly what caused what, because the order was the whole strategy.
Structure came first. Technical cleanup and intent consolidation stopped Google rotating between duplicate URLs. A single money page could now accumulate signals instead of splitting them. This is why average position started tightening in months 1 to 3 before any traffic breakout.
Content built authority. The 59 articles across 8 clusters did the heavy lifting. Breadth and depth of informational content is what earned topical authority (index 18 to 57) and generated internal-link equity. Those internal links, flowing through the hub-and-spoke architecture, pushed relevance into the commercial pages. Content is the cause; the money-page ranking gains are the effect.
Links and entities reinforced it. Referring domains (37 to 68) and cleaner entity/schema signals added external trust on top of the internal authority, without unnatural spikes.
Higher positions produced qualified clicks. As the money pages reached the top five for commercial and transactional intents, CTR climbed from 0.9% to 2.7%, and those clicks were high-intent because they matched query intent.
Qualified clicks became bookings. Conversions rose from 6 to 74. The informational traffic warmed future buyers and the commercial pages closed the ready ones. The compounding nature of this (month 12 being the peak) is exactly why authority content outlasts paid acquisition.
Decision Takeaways
- Fix intent collisions before writing anything new. Scaling content on top of cannibalized money pages wastes budget. Consolidate first, then build.
- Informational depth is the engine, not a side project. The money pages climbed because 59 cluster articles fed them authority and links. Volume plus depth across clusters is what builds durable rankings.
- Judge health by CTR and conversions, not raw impressions. The month 5 impression dip was progress. Pruning low-value pages raised the quality of everything downstream.
- Accept the losers that protect the winners. Letting the 'reviews' and 'specialist' terms slip was the right call to strengthen the primary money page and stay inside honest claim boundaries.
- Authority compounds; ads do not. The strongest month was the last one, because the content had matured. That asset keeps paying after the engagement, including into AI answer surfaces where deep content is increasingly what gets cited.