
This representative franchise lead-generation example moves from an average position near 36 to 9 while non-branded clicks move from 138 to 1,449 per month. Modeled monthly lead value moves from 1,000 to 10,000. Behind the headline curve is a clear sequence. The site first clarified technical and intent problems, then expanded useful informational coverage around the franchise research journey and connected that material to the pages where prospects could request information. The case includes plateaus and losing queries, which makes it a practical guide to sequencing and trade-offs across several workstreams working together.
Executive Summary
Starting Position
The scenario represents a national franchise lead-generation site used by prospective owners who research franchise options, compare opportunities, and decide whether to request more information. At the start, tracked non-branded queries averaged around position 36 and the site had broad but shallow visibility rather than strong ownership of its priority commercial themes.
Commercial pages overlapped, supporting articles were limited, and the internal path from research content to conversion pages was inconsistent. Domain Rating sat at 12 with 28 referring domains, the authority baseline that the later link recovery and outreach work built on.
The operating constraints were practical: meaningful national and local competition, limited monthly production capacity, and a strict rule against unsupported claims about franchise opportunities, costs, financing, outcomes, territory, operations, or other buyer-sensitive topics. That made page purpose and editorial discipline more important than simply increasing URL count.
What Needed Fixing
The audit separated three problems that could otherwise be mistaken for a single traffic issue.
Commercial intent was too concentrated. The existing service destination /services/franchise-business was trying to cover too many commercial and transactional queries at once. The decision was to clarify which buyer intents belonged on that page and which deserved distinct, useful supporting destinations.
Low-value URLs diluted the site structure. Template duplication, inconsistent canonicals, and crawlable pages with little strategic value made the priority content harder to assess cleanly.
Buyer research coverage was incomplete. Prospective franchisees investigate financing, fees, disclosure basics, brand comparison, territory, operations, and owner experience before they submit a lead. The site had too little useful material connecting those questions with the relevant commercial pages.
The sequencing decision was therefore straightforward: fix page roles and technical ambiguity first, then expand the research layer where it could answer a real question and support a clear internal path.
Work Sequence
The engagement used six existing workstreams, but the important part is how they were ordered.
1. Technical SEO and indexation cleanup (months 1 to 3)
Crawl and indexation triage came first, followed by canonical and redirect cleanup, template duplication review, Core Web Vitals checks, and internal status-code validation. The aim was a cleaner technical baseline for priority pages. In the modeled data, average position changes from 36.3 to 24.8 by month three, the first measurable step in the trajectory that later reaches 9.
2. Information architecture and internal linking (months 2, 3, 5)
Commercial and transactional intents were mapped to clearer destinations, overlapping pages were consolidated where appropriate, internal anchors were redistributed, and conversion paths were shortened. The operating goal was to make it obvious which page answered each franchise-buyer question instead of letting several URLs compete for the same role.
3. Authority content and intent alignment (months 2 to 4), then scaled
The modeled content program reaches 86 articles across 8 topic clusters, covering how franchising works, financing and funding routes, fees and cost structures, legal and disclosure basics, evaluating brands, territory and location decisions, day-to-day operations, and owner-review or outcome questions. Each page was intended to be useful on its own and to link contextually toward the appropriate commercial destination.
The internal topical-authority measure moves from 25 to 62, while informational visibility reaches roughly 866 keywords. These are scenario observations, not official Google scores. The practical takeaway is that a broader, organized research library can support clearer internal linking and subject coverage for each franchise-buyer question it answers.
4. Entity, schema and AI presence (months 3 to 5)
Organization and Service schema were cleaned up, author and reviewer references were aligned, citation consistency was checked, and concise answer blocks were added where the underlying page supported the claim. The goal was clearer machine-readable context for search and AI answer surfaces, with each answer block tied to a claim the page itself supports.
5. Digital PR and link recovery (months 4 to 6)
The scenario records referring domains moving from 28 to 62 and Domain Rating from 12 to 23. Lost-link recovery, relevant citation cleanup, unlinked mentions, and selective industry-resource outreach were treated as reinforcement work alongside the content and architecture program.
6. Brand voice and editorial QA (months 1, 2, 4)
Editorial review kept franchise claims within what the available evidence supports, especially around fees, financing, comparisons, brand opportunities, territory, expected outcomes, and operational statements. The purpose was to prevent unsupported sales language from being introduced during SEO expansion.
Stage-by-Stage Timeline
Months 1 to 3 - foundation. Clicks move from 138 to 294 and impressions from 27,539 to 41,997, while average position changes from 36.3 to 24.8. Tracked conversions move from 4 to 8. The first content batches reach 4, then 10, then 16 cumulative articles. This stage combines technical cleanup, page-role clarification, and initial cluster seeding.
Month 4 - architecture begins to pay off. Clicks reach 449, tracked conversions reach 11, and average position reaches 21.8. The useful change is that commercial and supporting pages now have clearer internal relationships.
Month 5 - quality pivot. Month 5 remains flat enough to force a decision: clicks remain at 449 while sessions are 375. Instead of increasing production simply to maintain volume, the program shifts toward consolidating weak pages, pruning unnecessary overlap, and reinforcing the pages most closely aligned with qualified franchise enquiries.
Months 6 to 8 - broader search lift. Clicks move through 616, 785, and 897; conversions move through 18, 23, and 26; average position reaches 13.8. The content library passes 50 articles while the internal topical-authority measure also crosses 50. Both counts track how complete the franchise-buyer research library has become.
Months 9 to 12 - later-stage consolidation. Clicks move through 1,037, 1,141, 1,436, and 1,449 while average position settles at 9. Month 11 records 40 conversions on 1,212 sessions. The library finishes at 86 articles and the internal topical-authority measure at 62. Months 11 and 12 are nearly flat on clicks, moving from 1,436 to 1,449, which is useful evidence that growth was not linear.
Measured Results
The modeled comparison between month 1 and month 12 records clicks moving from 138 to 1,449, impressions from 27,539 to 96,622, average position from 36.3 to 9, tracked leads from 4 to 40, modeled monthly lead value from 1,000 to 10,000, Domain Rating from 12 to 23, and referring domains from 28 to 62.
The starting search view shows a site receiving impressions without earning a proportionate share of clicks.
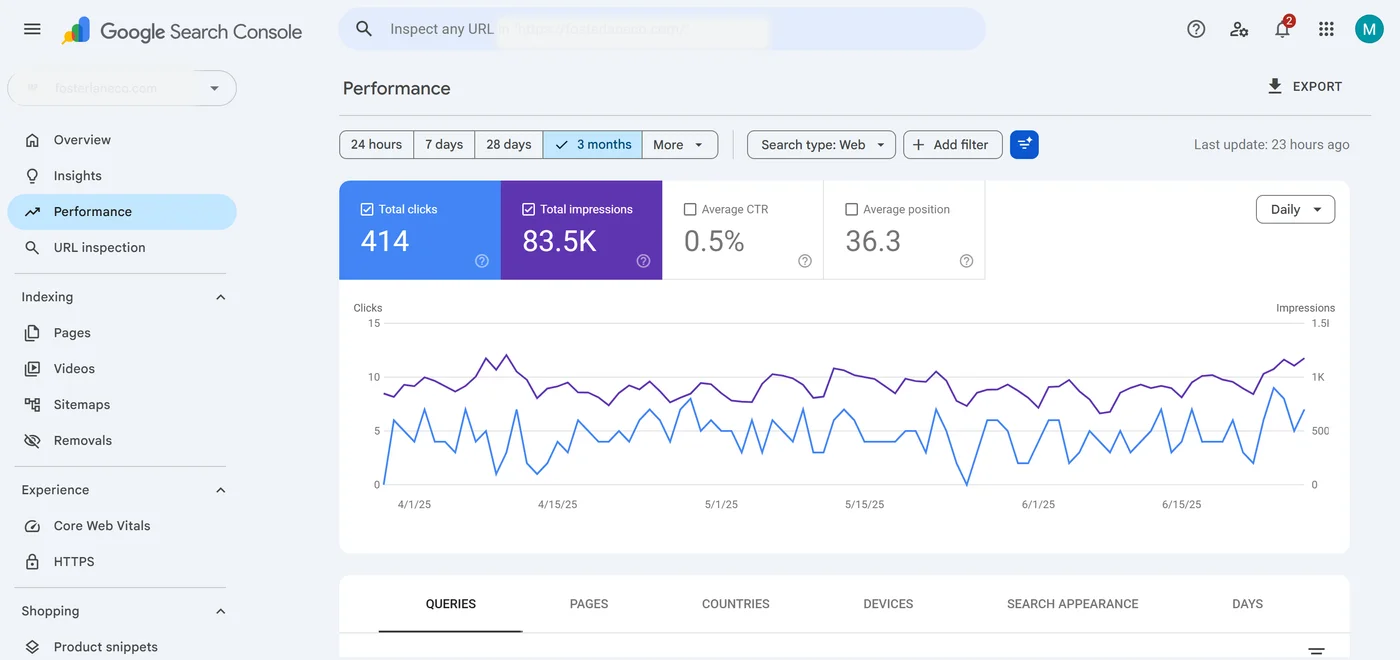
At the later endpoint, the scenario records impressions near 96,622 and CTR moving from 0.5% to around 1.5%. That is consistent with stronger average rankings and a more qualified query mix, with search-result presentation, demand, brand recognition, and competition shaping the same click curve.
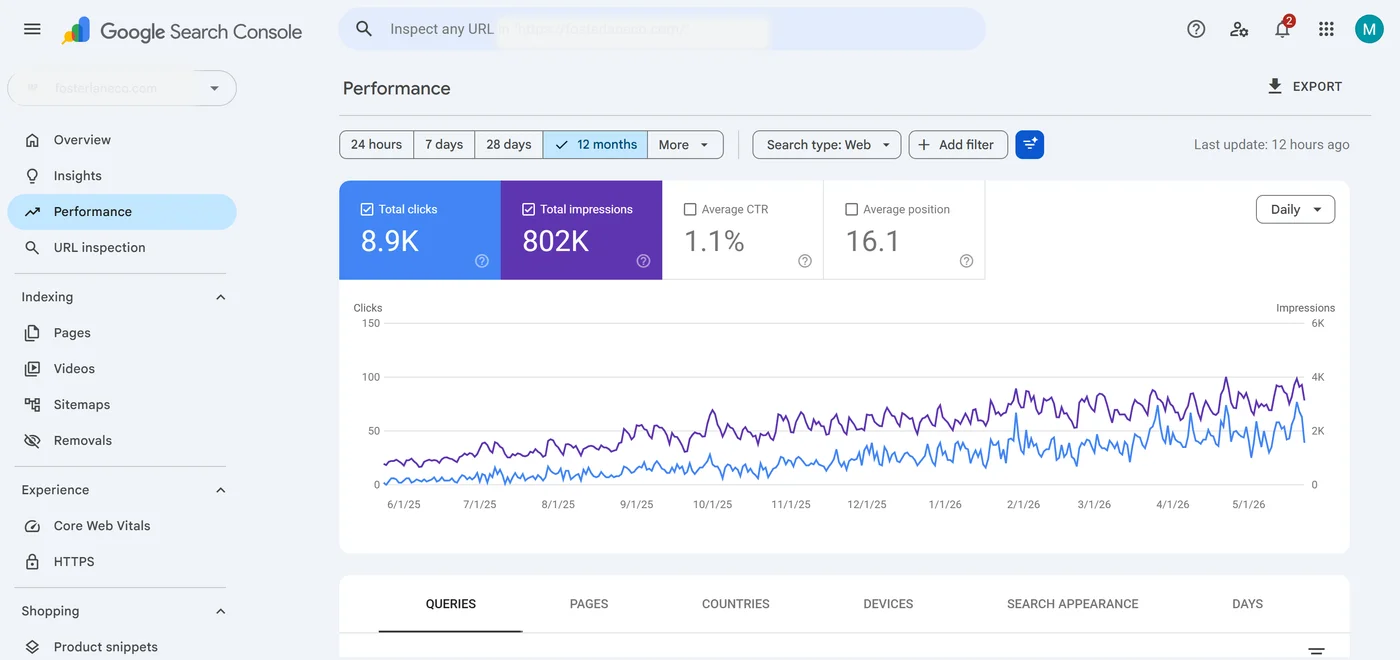
Read side by side, the baseline and end-state views show impressions, clicks, and CTR rising together, which is the pattern to look for when you check whether the trajectory, trade-offs, and internal relationships are coherent.
Keyword Movement
The query-level view is most useful when separated by intent. Several transactional and comparison structures improve materially, while broad, local, and informational terms do not all follow the same pattern.
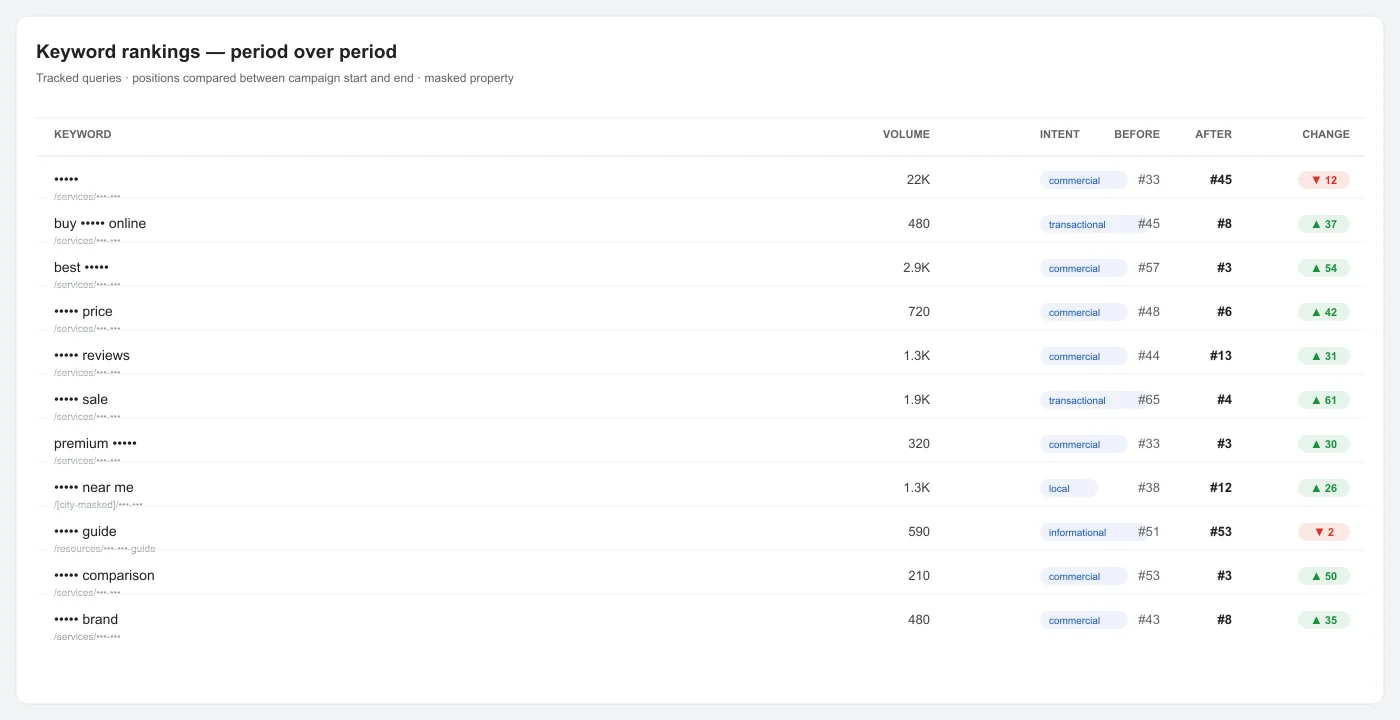
The table lists the modeled positions and masked query structures. It shows mixed movement: several buyer-intent structures gain sharply while the broad, local, and informational terms decline, swing, or stay flat.
| Query structure (masked) | Intent | Volume | Before | After | Category |
|---|---|---|---|---|---|
| ••• business | Commercial | 22,000 | 33 | 45 | Decliner |
| buy ••• business online | Transactional | 480 | 45 | 8 | Winner |
| best ••• business | Commercial | 2,900 | 57 | 3 | Winner |
| ••• business price | Commercial | 720 | 48 | 6 | Winner |
| ••• business reviews | Commercial | 1,300 | 44 | 13 | Winner |
| ••• business sale | Transactional | 1,900 | 65 | 4 | Winner |
| premium ••• business | Commercial | 320 | 33 | 3 | Winner |
| ••• business near me | Local | 1,300 | 38 | 12 | Volatile |
| ••• business guide | Informational | 590 | 51 | 53 | Stable |
| ••• business comparison | Commercial | 210 | 53 | 3 | Winner |
| ••• business brand | Commercial | 480 | 43 | 8 | Winner |
| ••• business store | Commercial | 390 | 29 | 14 | Volatile |
| custom ••• business | Commercial | 140 | 29 | 35 | Decliner |
| ••• business shipping | Commercial | 110 | 46 | 4 | Winner |
| ••• business financing | Commercial | 590 | 36 | 8 | Winner |
| ••• business warranty | Commercial | 90 | 52 | 10 | Winner |
The broadest head term, at 22,000 volume, moves from 33 to 45 and should be reported as a clear loss. The local near-me structure moves from 38 to 12 but remains volatile, while the informational guide structure moves from 51 to 53 and is effectively flat. Those outcomes make the core decision visible: prioritize pages that cleanly match high-value buyer intent while keeping broad or ambiguous losses in the record.
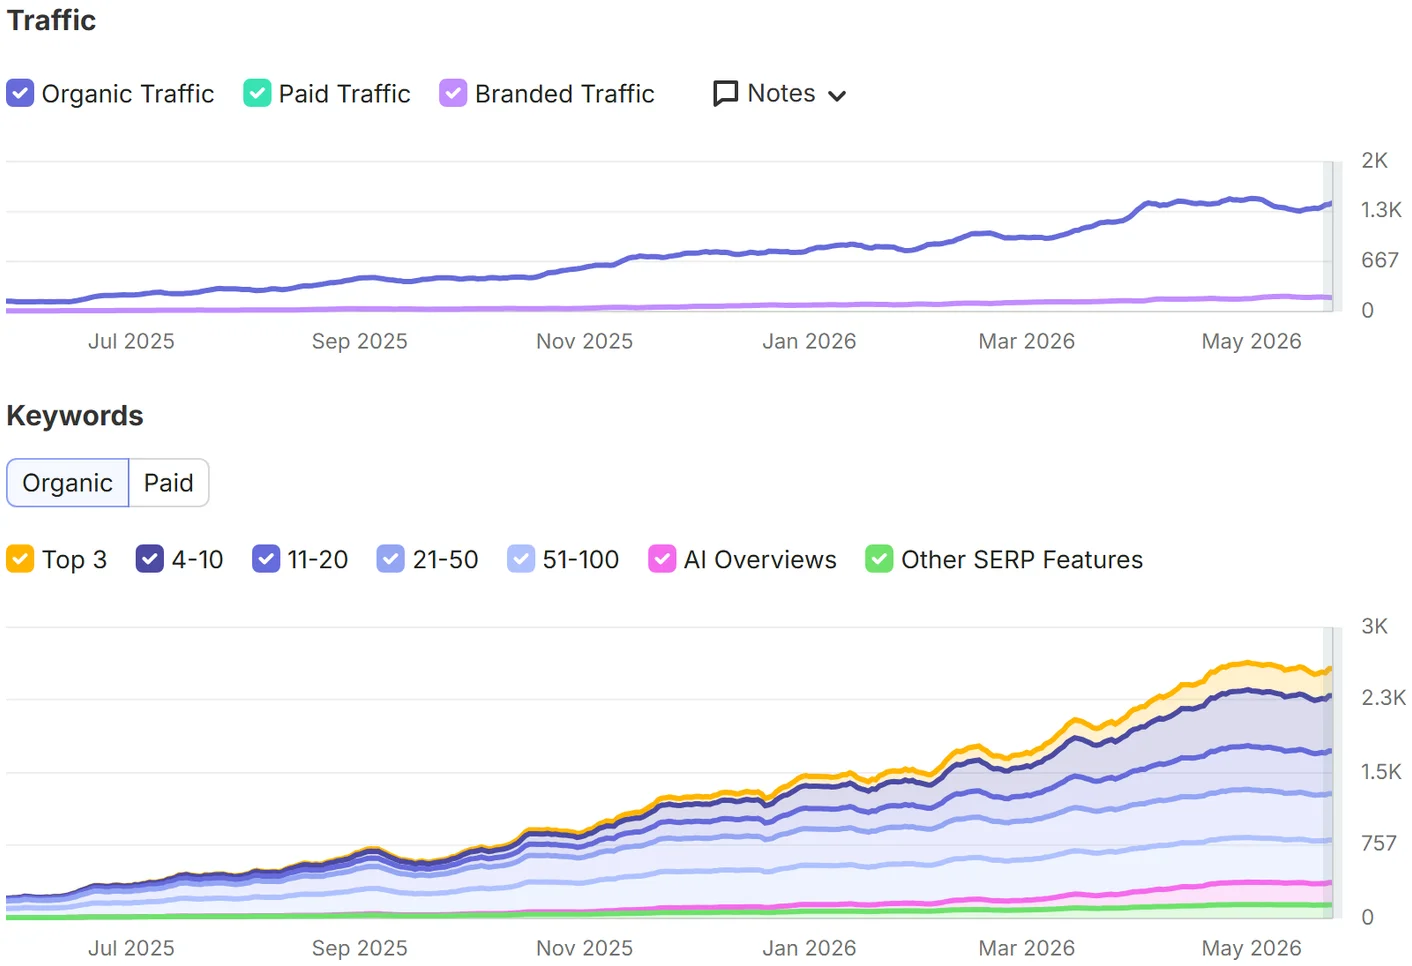
A third-party-style visibility overview of the same scenario completes the keyword view.
Business Interpretation
The scenario records tracked leads moving from 4 to 40 per month and modeled lead value moving from 1,000 to 10,000. The value is a modeled pipeline figure rather than CRM close data; use it to size the lead value a comparable program could support.
The supporting library reaches 86 articles across 8 clusters, with the internal topical-authority measure moving from 25 to 62. Its practical purpose is to help prospective franchisees research costs, financing, disclosure basics, brand comparison, territory, operations, and related decisions before they submit an enquiry. Each of those pages links toward the commercial destination that matches the visitor's next step.
The durable asset is the organized body of useful information and the clearer paths between research pages and commercial destinations. The article count, internal metric, and link totals describe how that asset was built over the 12 months.
Clear entity information and concise, evidence-backed summaries can make content easier for AI systems and Google AI Overviews to interpret. This example does not track AI citations or recommendations, so AI visibility needs its own measurement alongside the search figures.
Evidence Limits
The timeline contains genuine plateaus. Month 5 is flat enough to trigger a change in allocation, and months 11 to 12 are also near-flat. The month 5 plateau matters because clicks move from 1,436 to 1,449 rather than continuing a steep curve, so the endpoint should not be extrapolated linearly.
The content published in months 2 to 5 is associated with later movement in months 8 to 11, a gap to plan around when you schedule content work. Search performance can also change because of competition, demand, link acquisition, query mix, algorithm updates, or other factors.
Local queries remain volatile and some tracked terms decline. The figures in this representative example are anonymized, modeled metrics; private client identifiers such as name, domain, raw queries, and CRM close data are not represented. The case is best used to study prioritization, page roles, and measurement.
What Likely Contributed
Several workstreams contributed, in a deliberate sequence.
Clearer architecture came first. The modeled site moves from an average position around 36 to 25 during the early foundation stage, while duplicate intent and crawl waste are being addressed.
Supporting content expanded the research layer. The library reaches 86 articles across 8 clusters, while the internal topical-authority measure moves from 25 to 62. Those observations support the decision to build more complete franchise-buyer coverage across all 8 topic clusters.
External authority reinforced the site later. Domain Rating moves from 12 to 23 as the referring-domain profile grows. That activity reinforced the architecture and content work rather than replacing it.
Search behavior changes with the overall visibility profile. CTR moves from 0.5% to 1.5%, while tracked leads reach 40 at the later endpoint. The relationship is coherent, with rankings, query mix, on-SERP presentation, competition, and user behavior all shaping the result.
Decision Takeaways
The scenario begins around position 36 and later reaches 25 during foundation work; the broader lesson is to fix page roles before scaling. The modeled library then reaches 86 articles across 8 clusters and roughly 866 informational keywords. The 5 decisions below turn that sequence into a plan.
- Clarify intent before adding pages. A single franchise service page should not be expected to satisfy every commercial, local, transactional, and informational query.
- Build research content around real franchise-buyer questions. Financing, fees, disclosure, territory, operations, brand comparison, and owner-experience topics can support better decisions when the content is accurate and useful.
- Keep broad losses visible. The biggest head term declines while more specific buyer-intent structures improve. That trade-off belongs in the analysis rather than being hidden.
- Pivot when production stops adding value. A plateau is a reason to inspect weak pages, internal paths, and intent overlap rather than automatically publish more.
- Treat AI visibility as a separate measurement problem. Structured, evidence-backed content may help machine interpretation, so track citations and recommendations with their own measures.