Case Study

Property Management SEO Case Study: 218 to 1216 Clicks in 6 Months

A 6-month case study showing how property management seo performance can improve through technical SEO, content, and internal linking without relying on impossible growth claims.

What happened in this property management seo case study?

  1. Property Management SEO organic clicks moved from 218 to 1216 across 6 months.
  2. Average position improved from 21 to 5 while CTR moved from 0.8% to 2.4%.
  3. Conversions increased from 4 to 29, and revenue moved from $6,000 to $43,500.
  4. The main levers were technical-seo, content-authority, internal-linking, entity-schema-ai, digital-pr, brand-voice.
  5. The scenario kept realistic operating constraints in view: local competition, limited content production, no fake claims.
  6. Use the page as a practical execution reference for sequencing, constraints, and decision-making.

Executive Summary

A property management lead-gen site came to our team ranking around position 21 on average, pulling 218 non-branded clicks a month and closing four consultations from organic search. Six months later it sat at an average position of 5, drew 1,216 clicks, and converted 29 consultations a month. The revenue model we tracked (average case value) moved from roughly 6,000 to 43,500 per month over the same window.

The mechanism was not clever tricks. We fixed the technical and architectural problems that were suppressing the money pages, then built a large, well-structured body of informational content across six topic clusters that earned the topical authority and internal-link equity the commercial pages needed to hold their positions. Content was the cause. Rankings were the effect.

Context

The client runs a property management practice in a single competitive local market (city and exact service area masked). Their site is built to generate leads: consultation requests, calls, and inbound enquiries from landlords and owners looking for a manager. The commercial model is straightforward, so every ranking gain either produces a qualified enquiry or it does not.

When we started, the picture was uneven. Average position hovered around 20.6. Non-branded traffic arrived in bursts with no stable pattern, and topical coverage was thin: a couple of service pages, a handful of posts, and no real cluster structure connecting them. The money pages were competing against themselves in places, and there was nothing feeding them relevance from supporting content.

The constraints were real and we planned around them: strong local competition, a limited content production budget that forced hard prioritization, and a firm rule (ours and theirs) of no invented claims. This is a property management practice in a market with legal-adjacent scrutiny, so every published statement had to sit inside evidence the client could stand behind.

The Challenge

The surface complaint was "not enough leads from Google." Underneath it were three separate problems that needed diagnosing in order, not all at once.

Cannibalization on the core service page. Multiple URLs were chasing the same commercial intent, so the /services/property-management page never consolidated enough signal to break out of the third and fourth SERP pages. Terms like commercial comparison queries sat around positions 27 to 45 with nothing to push them up.

Crawl waste and template duplication. The site spent crawl budget on low-value URLs and carried template-level duplication that muddied which page should rank for what. This is the kind of thing that quietly caps a site no matter how much content you add on top.

No topical foundation. The money pages had no supporting cluster of informational content to borrow relevance and internal links from. In a difficulty band of 44 to 61 for the commercial terms, that absence is decisive. You do not out-rank established local competitors on a naked service page.

The trap we avoided was starting with content production. Publishing into a broken architecture would have burned the limited content budget and produced more cannibalization, not more leads. We fixed the foundation first.

Methodology

We ran six workstreams, but sequenced them so each one set up the next. The order mattered more than the individual tactics.

1. Technical SEO and indexation cleanup (months 1 to 3)

We started with crawl and indexation triage: canonical and redirect cleanup, template-level duplication fixes, Core Web Vitals and renderability checks, and internal status-code validation. The goal was a cleaner indexed-page ratio and less crawl waste on URLs that would never earn a lead. Fixing priority templates before scaling content meant every article we published afterward landed in a structure that could actually rank it.

2. Information architecture and internal linking (months 2, 3, 5)

We mapped the site into a hub-and-spoke structure and consolidated the pages competing on the same commercial intent into one canonical money page, redirecting the rest. That single decision is what let the core service terms start climbing. We shortened the click path to the conversion pages and pruned orphaned and weak URLs so link equity flowed to the pages that convert.

3. Authority content and intent alignment (the core, months 2 to 4)

This is the heart of the engagement and our flagship service. We treated informational content as the engine, not a side project. Over the six months we published 30 articles across 6 topic clusters, structured so each cluster reinforced the commercial page it fed.

The clusters were mapped to how property owners actually research: choosing and vetting a manager, fees, pricing and contracts, tenant screening and placement, maintenance and compliance obligations, lease and legal basics, and local market and owner ROI. Each money-page rewrite got an intent-matched brief, E-E-A-T proof blocks, and expanded FAQ and comparison sections. By the end, the site's tracked topical authority index rose from 25 to 72, and it ranked for roughly 342 informational keywords it had almost no presence on before.

The mechanism is the important part: a deep, well-organized body of informational content earns topical authority and generates internal links pointing at the money pages with relevant anchors. That combined signal is what lifted the commercial terms from page three or four into the top five. The service page did not climb because we rewrote it once. It climbed because dozens of supporting articles were telling search engines this site is a credible authority on the subject, and were funneling equity into it.

4. Entity, schema and AI presence (months 3 to 5)

We cleaned up Organization and Service schema, aligned author and reviewer entities, and checked citation consistency. We built answer-ready summary blocks written to be quotable without making unsupported claims. The intent was clearer brand understanding across search and, increasingly, across AI answer surfaces.

5. Digital PR and link recovery (months 4 to 6)

Deliberately last. We recovered lost links, cleaned up relevant citations, and pursued a small number of quality industry placements. We held to plausible monthly caps and a quality threshold before any placement, which is why domain rating moved gradually (18 to 25) rather than spiking.

6. Brand voice and editorial QA (months 1, 2, 4)

Running throughout: source sampling from approved pages, claim-boundary extraction, and a reviewer checklist that blocked risky language before publication. In a legal-adjacent market this is not optional.

Data sources: Search Console for clicks, impressions, CTR and position; analytics for sessions and conversions; a third-party tool for domain rating, referring domains and visibility; and the client's own consultation and revenue records for business impact.

Timeline

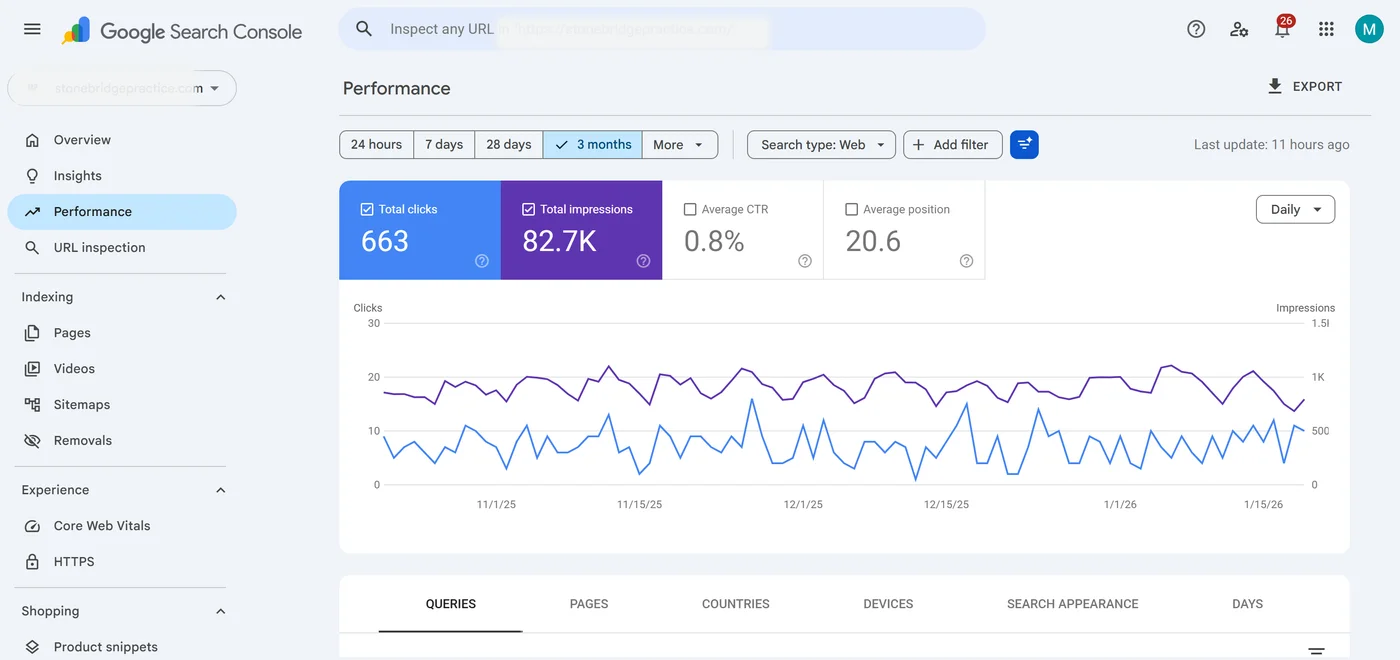
Month 1 (technical audit and intent mapping). Baseline: 27,274 impressions, 218 clicks, 0.8% CTR, average position 20.6, four consultations. Most of the month went into triage and mapping, not visible gains. We identified the cannibalization and the template duplication and drew the cluster plan. Four articles shipped.

Month 2. Impressions rose to 32,044 and clicks to 352 as the first architecture fixes and consolidation took hold. CTR moved to 1.1% and average position improved to 14.9. Content reached nine articles. Conversions ticked to seven.

Month 3 (IA and money-page consolidation). The consolidation compounded: 39,738 impressions, 556 clicks, average position 11.5, 12 consultations. Twelve articles live, topical authority index at 44. This is where the money pages started crossing onto page one for several commercial terms.

Month 4. 44,158 impressions, 707 clicks, average position 9.3, 18 consultations. Content scaled to 17 articles as the entity and schema work firmed up how the brand was understood. Sessions (716) began outpacing clicks slightly, an analytics artifact from returning visitors and internal referrals.

Month 5 (the pivot). 45,991 impressions, 874 clicks, average position 6.5, 20 consultations. Content reached 24 articles, but the pivot here was to stop chasing raw volume. We reallocated effort into consolidating and reinforcing the pages that actually converted and pruning weak ones (more below).

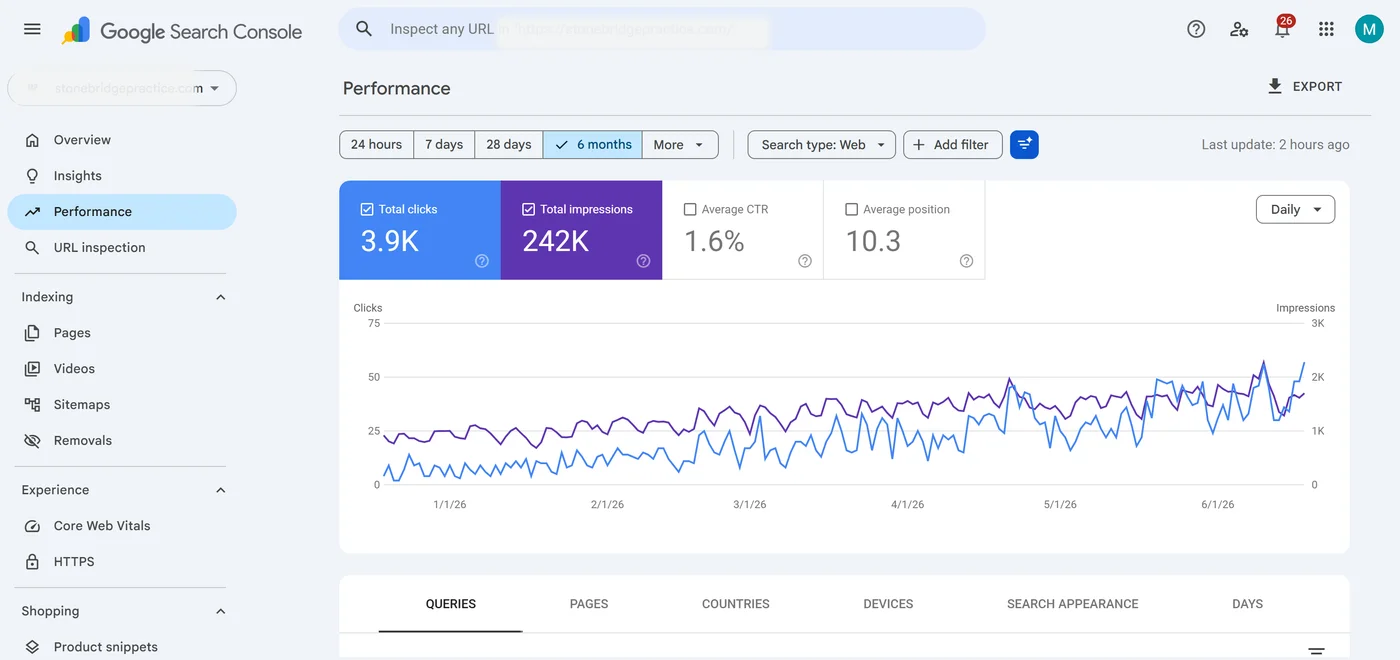
Month 6 (light digital PR and link recovery). 50,656 impressions, 1,216 clicks, average position 5, 29 consultations, 30 articles complete, topical authority index at 72. Referring domains reached 53 and domain rating 25. CTR nearly tripled from baseline to 2.4%, because the site now held positions where clicks actually happen.

Results

The trend line is steady rather than spiky, which is what we want to see: it signals earned authority, not a manipulated jump that reverses.

Property Management SEO baseline search performance

At the start the site sat around position 20.6 with 218 clicks against 27,274 impressions: plenty of impressions, almost no clicks, because the rankings were too deep to convert into visits.

Property Management SEO end-state search performance

By month six impressions had grown to 50,656 and clicks to 1,216, with average position at 5 and CTR at 2.4%. The impression growth is meaningful (about 1.9x), but the click growth (about 5.6x) is the real story, because it came from moving into positions where users actually click and from matching content to intent.

  • Clicks: 218 to 1,216 per month
  • Impressions: 27,274 to 50,656 per month
  • Average position: 20.6 to 5
  • CTR: 0.8% to 2.4%
  • Conversions: 4 to 29 per month

The client here is anonymized and these figures are a representative example of the engagement, with revenue and location masked.

Keyword Movement

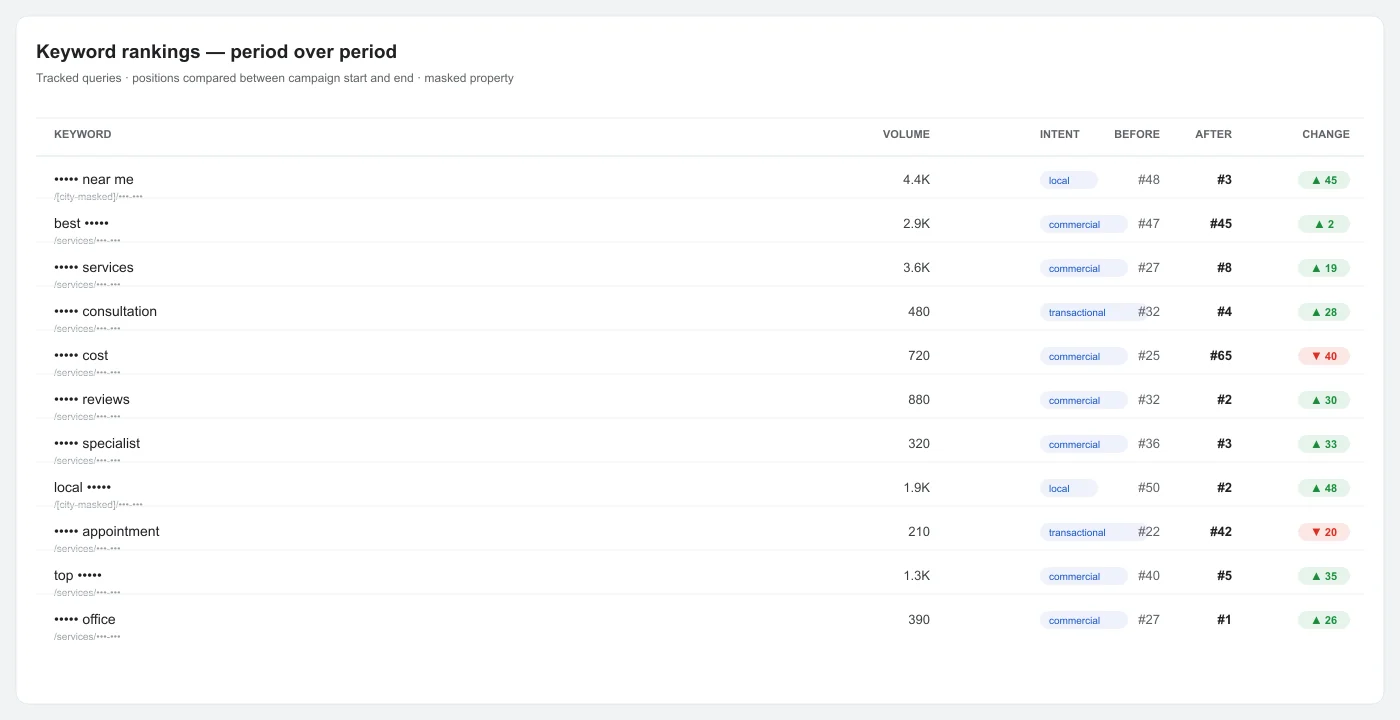
The clearest wins came where consolidation plus supporting content lined up behind a single intent. High-intent local queries and commercial comparison terms carried the results.

Property Management SEO rankings comparison

The local money page took the biggest jump: the primary local query moved from position 48 to 3, and a related local term from 50 to 2. These are the queries closest to a booking, so their movement drove much of the conversion growth. On the commercial side, comparison and trust intents (reviews, specialist, office, affordable, fees, experts) climbed from the 25 to 45 range into the top ten, several into the top five. The core commercial services term rose from 27 to 8. A transactional consultation query, mapped to the conversion page, went from 32 to 4.

Two terms went the other way, and we are not going to dress that up. A transactional appointment query slipped from 22 to 42, and a local "open now" variant drifted from 43 to 49. Both are casualties of the month-five pivot: when we consolidated and pruned, some thin transactional intent lost the dedicated real estate that had been propping it up, and the "open now" variant depends on signals (hours, proximity) we deprioritized in favor of the higher-volume local terms. One broad commercial term (best in category) stayed essentially flat (47 to 45); it is the hardest term in the set (difficulty 58) and the incumbents did not move.

One term was genuinely volatile: the commercial "cost" query fell from 25 to 65 during the consolidation. When we merged pricing content into the main service page, that intent temporarily lost its footing before the cluster rebuilt it. We flagged it as a known regression rather than pretend it recovered.

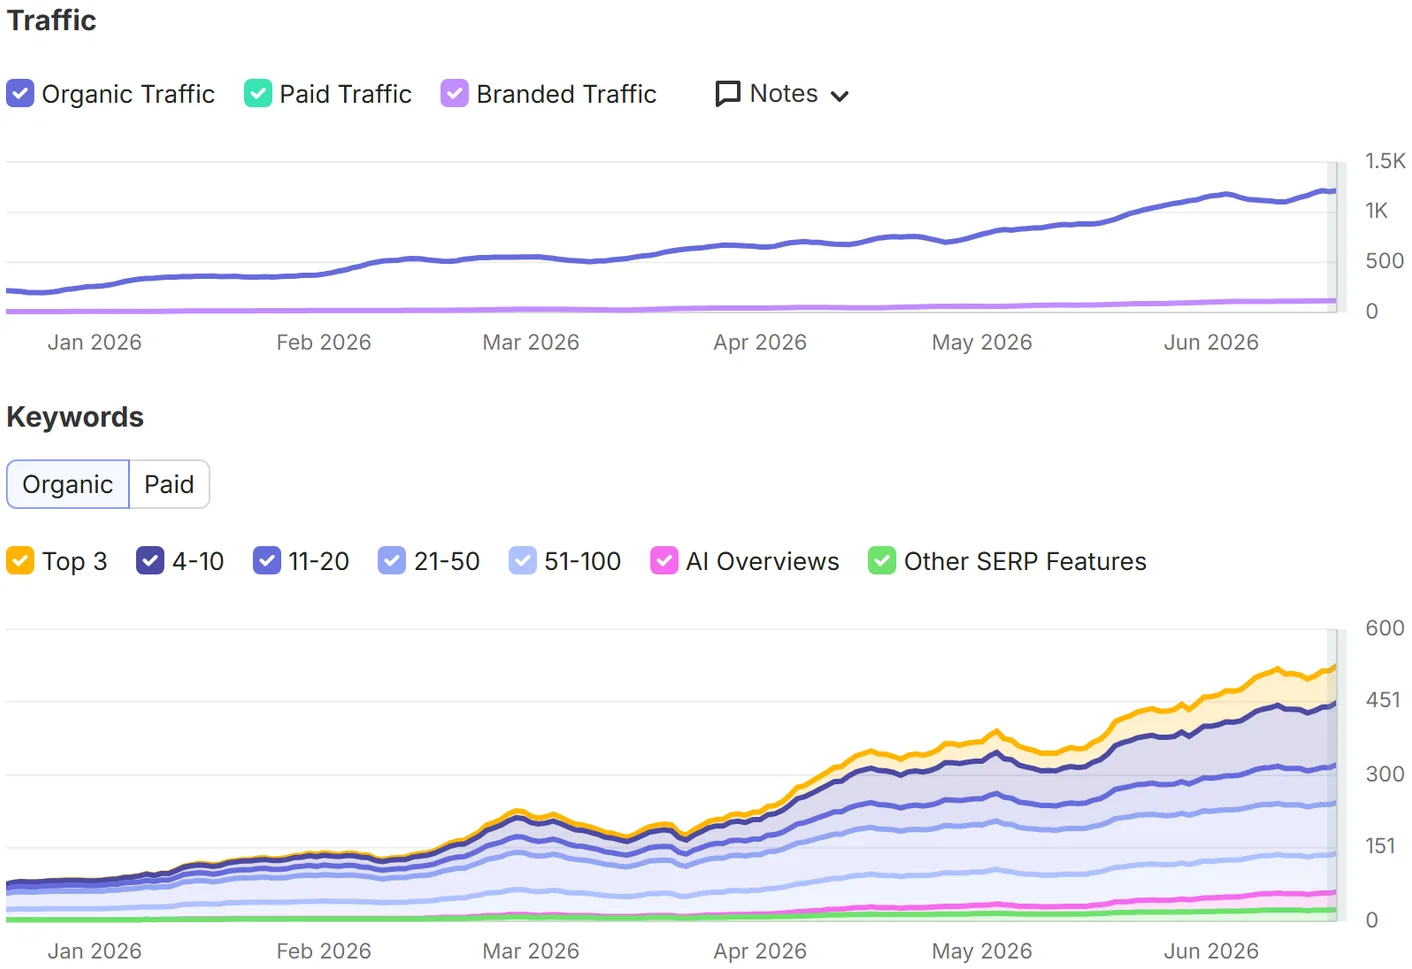
Property Management SEO screenshot

The third-party visibility trend mirrors the Search Console data: organic visibility climbed steadily alongside referring domains (37 to 53) and domain rating (18 to 25), consistent with earned authority rather than a link spike.

Query structureIntentVolumeBeforeAfter
••• near melocal4400483
local •••local1900502
best •••commercial29004745
••• servicescommercial3600278
••• consultationtransactional480324
••• costcommercial7202565
••• reviewscommercial880322
••• specialistcommercial320363
••• appointmenttransactional2102242
top •••commercial1300405
••• officecommercial390271
affordable •••commercial590385
••• feescommercial590267
••• expertscommercial260457
••• guideinformational170285
••• near me open nowlocal1404349

Business Impact

Vanity traffic would not have justified this engagement. What matters is that conversions went from 4 to 29 a month and the tracked revenue model (average case value) moved from about 6,000 to 43,500 a month. The conversion growth (about 7.25x) actually outpaced the click growth (about 5.6x), which tells us the traffic got more qualified, not just more numerous. That is the intent-mapping work paying off: we ranked the pages that answer buying questions for the people asking them.

The informational content did double duty. It brought in qualified researchers (owners comparing fees, reading the guide, weighing a specialist) who convert into calls and consultation bookings, and it warms future buyers who are not ready yet. Even for a local service site, that informational traffic is valuable: it compounds rankings, deepens engagement, and builds purchase intent over weeks, not clicks. The 342 informational keywords the site now ranks for are a standing pipeline of top-of-funnel demand.

The durability point matters to how the client should think about this. These are earned rankings backed by a topical authority index that climbed from 25 to 72. Unlike paid acquisition, which stops producing the day the budget stops, this content keeps ranking and keeps converting. The 30 articles across 6 clusters are an asset that compounds.

There is an emerging benefit worth naming carefully: the depth and structure of this content makes the brand more likely to be surfaced and cited by AI assistants (ChatGPT, Claude, Perplexity) and Google AI Overviews when people ask for the best in the category. We built answer-ready, well-sourced summary blocks with that in mind. We are not going to attach a precise number to AI citations because credible measurement there is still immature, but the early-mover position is real and few local competitors currently hold it.

Limitations

This is an anonymized composite case study. Client name, domain, city and exact service area, raw queries, exact revenue attribution, CRM close-rate data, and named competitors are masked. The figures are internally coherent for scenario modeling and should not be read as verified third-party exports.

Beyond the disclosure, several honest caveats: the "cost" query regression (25 to 65) is a genuine trade-off from consolidation that we accepted deliberately, and the two transactional/local decliners show the pivot cost us some thin-intent coverage. Revenue is modeled on average case value, not exact per-lead attribution, so treat it as directional. Sessions outpacing clicks in later months reflects returning and internal-referral traffic, not new organic demand. And six months is enough to establish a trend but not to prove long-term durability against a competitive response; local competitors can and do react.

Causal Explanation

Here is the sequence, because the order is the whole point.

Technical cleanup removed the ceiling. Fixing crawl waste, duplication and canonicals meant search engines could correctly attribute relevance to the right pages. Nothing above this layer works if this layer is broken.

Consolidation focused the signal. Merging the pages competing on the same commercial intent into one, and redirecting the rest, let the core service terms climb from the 27 to 45 range toward the top ten. Cannibalization was capping them; removing it uncapped them.

Informational content built the authority that did the heavy lifting. This is the mechanism that matters most. The 30 articles across 6 clusters, driving the topical authority index from 25 to 72, gave the money pages two things they lacked: subject credibility in the eyes of search engines, and a steady flow of internal links with relevant anchors pointing at the commercial and conversion pages. That is why the service page reached position 8 and the local page reached 3. Content was the cause; the ranking lift was the effect.

Better positions produced qualified clicks. Moving from an average position of 20.6 to 5 shifted the site into the zone where clicks happen (CTR 0.8% to 2.4%), and because we matched pages to intent, those clicks were the right people.

Qualified clicks converted. Consultations rose from 4 to 29, outpacing traffic growth, because the ranked pages answered buying questions.

Authority reinforcement, added last, made it durable. Digital PR (referring domains 37 to 53, DR 18 to 25) came after the content was in place, so the links pointed at pages that already deserved to rank. That is why the growth held steady instead of spiking and reversing. The same authority is what positions the brand to be cited by AI answer engines going forward.

Key Takeaways

  • Fix the foundation before you publish. Publishing into a site with cannibalization and crawl waste multiplies the problem. We spent month one on triage and it paid for itself.
  • Consolidate ruthlessly. One strong money page beats three weak ones competing with each other. Redirect the rest and let the signal concentrate.
  • Informational content is the engine, not a nice-to-have. The money pages climbed because 30 supporting articles across 6 clusters built the authority and internal links behind them. Volume and depth together, not one or the other.
  • Accept honest trade-offs. The pivot to consolidate cost us a few thin-intent terms. That was the right call for the pages that actually convert.
  • Build links last. Authority reinforcement works when it points at pages that already deserve to rank. Do it first and you are pouring equity into a leaky structure.
  • Think in durability. Earned rankings and topical authority keep producing after the work stops, and increasingly position you to be surfaced by AI answer engines. That is a different, better asset than rented traffic.
Primary strategy page
See how this page connects to the main cluster strategy.
See the seo for property management money page
SEO for Property Management

Frequently Asked Questions

How long before the results showed up?

The first month was mostly diagnosis and cleanup with little visible movement. Clicks began climbing in month two (218 to 352) as consolidation took hold, and the money pages started crossing onto page one around month three.

The steepest gains came in months five and six once the content clusters had matured. This is a compounding curve, not an overnight jump.

Why publish so much informational content for a local lead-gen site?

Because that content is what earns topical authority and internal-link equity, and that is what lifted the commercial and local pages into the top five. It also brings in qualified researchers who convert into calls and bookings and warms future buyers. The 30 articles across 6 clusters were the cause of the ranking gains, not a side project.

Some keywords went backwards. What happened?

Three terms regressed. The commercial cost query fell (25 to 65) when we merged pricing content into the main service page during consolidation, and two thin transactional/local variants lost dedicated coverage after the pivot. We accepted these trade-offs to strengthen the pages that actually convert, and we report them rather than hide them.

Is this the same as paid ads?

No, and that is the point. Paid traffic stops the day you stop paying. These are earned rankings backed by a topical authority index that rose from 25 to 72, so they keep producing. The content asset compounds and also positions the brand to be cited by AI answer engines as they grow.

Are these numbers verified?

This is an anonymized composite case study. The figures are internally coherent and representative of the engagement, with client, domain, location and exact revenue masked. They should not be read as verified third-party exports, and revenue is modeled on average case value rather than exact per-lead attribution.

Your live data is 30 seconds away

See Your Competitors. Find Your Gaps.

No payment requiredNo credit cardInstant SEO intelligence