
The modeled agency scenario began around average position 21 and ended around 4. Monthly clicks moved from 231 to 1,620, tracked conversions from 9 to 80, and the lead-value model from 2,250 to 20,000. Those figures are useful as one internally coherent campaign shape, not proof that a single tactic produced the outcome. The decision-useful lesson is the order of work: resolve indexation and intent conflicts first, expand useful support content second, and then use conversion evidence to decide what should be consolidated, reinforced, or stopped.
Case Study at a Glance
Starting Conditions
The client is represented as a marketing agency competing in a local professional-services market. The name, domain, and exact service area are masked, so the case study discusses query intent and page roles instead of exposing raw terms or private identifiers. The site functioned as a lead-generation property where consultations and appointments mattered more than pageview volume.
The starting profile showed average positions around 21. The scenario also records Domain Rating at 14, 25 referring domains, 110 total backlinks, and an internal topical-authority index of 23. Those third-party metrics are part of the modeled scenario; use them as the baseline profile the plan had to work from.
Three constraints shaped the plan: strong competition, limited content-production capacity, and a no-fabrication rule for review counts, awards, authority claims, and other proof. That meant each page needed a clear role in the buyer journey instead of existing only to expand the site's footprint.
What Needed to Change
The audit separated the problem into page ownership, indexation quality, and subject coverage.
Commercial intent was fragmented. Several high-value queries were associated with overlapping pages, while tracked comparison terms sat at positions 42, 34, 45 and 30. The practical issue was not merely low rankings; it was uncertainty about which URL should be the strongest destination for each intent.
Crawl and indexation were noisy. Low-value URLs and repeated template elements consumed attention that should have been concentrated on the pages closest to leads.
The support layer was thin. The internal topical-authority index began at 23, and there were too few useful articles addressing what prospective agency clients research before contact. The program therefore treated supporting content as a way to answer real questions and improve internal pathways, not as an automatic ranking mechanism.
The operating decision was to repair the base before increasing publishing volume. Adding pages before resolving overlap would have created more URLs without clarifying which ones should matter most.
How the Program Was Sequenced
The work was organized into connected stages so later publishing rested on a clearer technical and structural foundation.
1. Technical SEO and indexation cleanup (months 1 to 3)
Crawl and indexation triage came first, followed by canonical and redirect review, template duplication cleanup, and validation of status codes and existing schema. The scenario records average position at month 1 as 21.0, month 2 as 13.8, and month 3 as 11.2. That timing is consistent with the cleanup stage, but it does not isolate technical work as the sole cause.
2. Information architecture and internal linking (months 2, 3 and 5)
Hub-and-spoke mapping, consolidation of overlapping commercial destinations, redirects where appropriate, contextual anchor distribution, shorter paths toward enquiry pages, and pruning of weak or orphaned pages were used to make page ownership clearer.
3. Authority content and intent alignment (months 2 to 4)
The support-content program recorded 31 articles across 8 topic clusters. The clusters addressed buyer questions around pricing, deliverables, provider comparison, local considerations, consultation and onboarding, contracts and scope, measurement and reporting, and getting started. By the end of the study, the scenario recorded 697 informational keywords and an internal topical-authority index moving from 23 to 65.
Those figures are observations within the model. Their value is in showing that broader subject coverage and commercial visibility developed together. The program did not assume that article count itself causes rankings; each page needed a distinct purpose and a relevant internal path toward the agency's commercial pages.
4. Entity, schema and AI presence review (months 3 to 5)
Existing Organization and Service schema was cleaned up, author and reviewer references were aligned, citation consistency was reviewed, and concise answer blocks were added where they helped readers. Clear, supportable content can be easier for Google AI Overviews and other AI systems to interpret, but there is no special markup or guaranteed citation mechanism implied here.
5. Digital PR, citations and link recovery (months 4 to 6)
External authority work stayed selective. The scenario records referring domains moving from 25 to 39 and DR from 14 to 18 during the period while lost links, citations, unlinked mentions, and relevant resource opportunities were reviewed. Those numbers are part of the scenario and show the selective, gradual pace of the authority work.
6. Brand voice and editorial QA (months 1, 2 and 4)
Editorial review ran throughout the program so claims, tone, and evidence boundaries stayed consistent. The no-fake-claims rule meant unsupported proof, invented social validation, and exaggerated outcomes were removed before publication.
Stage-by-Stage Progress
Month 1: 231 clicks, 9 tracked conversions, and average position 21.0. The work centered on audit and intent mapping, while 3 articles were live.
Month 2: Clicks reached 367, conversions 14, and average position 13.8. Content reached 7 articles and the internal topical-authority index 33. The correct reading is that indexation fixes, consolidation, and early content work overlapped.
Month 3: Clicks reached 577, conversions 23, average position 11.2, article count 10, and topical-authority index 41. Commercial-page consolidation and the growing support layer were both active by this stage.
Month 4: Clicks reached 757, conversions 31, average position 7.7, article count 17, and topical-authority index 49. Entity review and initial link-recovery work were also being layered in.
Month 5: Clicks reached 1,002, conversions 41, average position 6.3, article count 24, and topical-authority index 56. The team shifted emphasis away from raw output and toward consolidating weak pages and reinforcing destinations already contributing to qualified actions.
Month 6: Clicks reached 1,620, tracked conversions 80, and average position 4.0. The scenario also records a 60 percent month-over-month click increase, 80 conversions, commercial positions in the 1 to 5 range, 31 articles, and a topical-authority index of 65. Those end-state figures summarize the model and are not a guaranteed outcome for another agency.
What the Data Shows
At month 1, the site is represented with CTR near 0.9 percent.
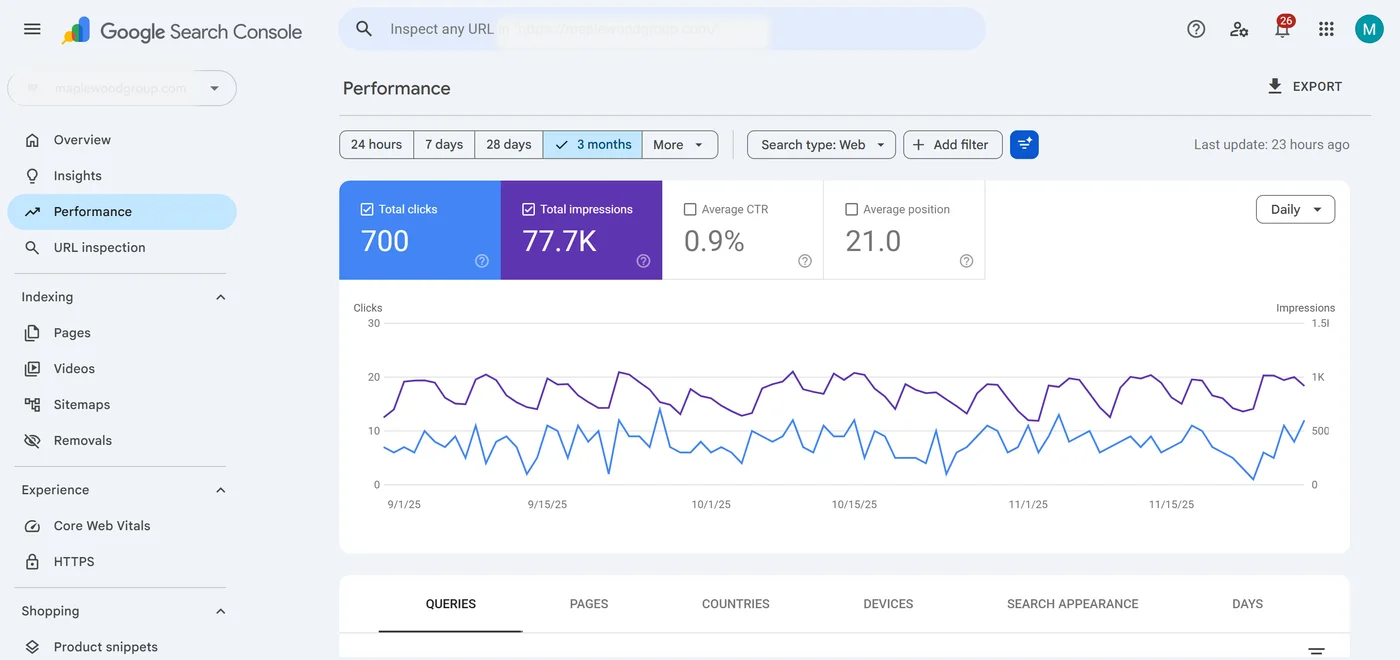
By month 6, impressions moved from 25,694 to 46,283, clicks from 231 to 1,620, and CTR from 0.9 to 3.5 percent. Average position moved from 4 at the end versus about 21 at the start. In this modeled dataset, clicks grew faster than impressions while positions improved, which is consistent with more visibility occurring where searchers were more likely to click.
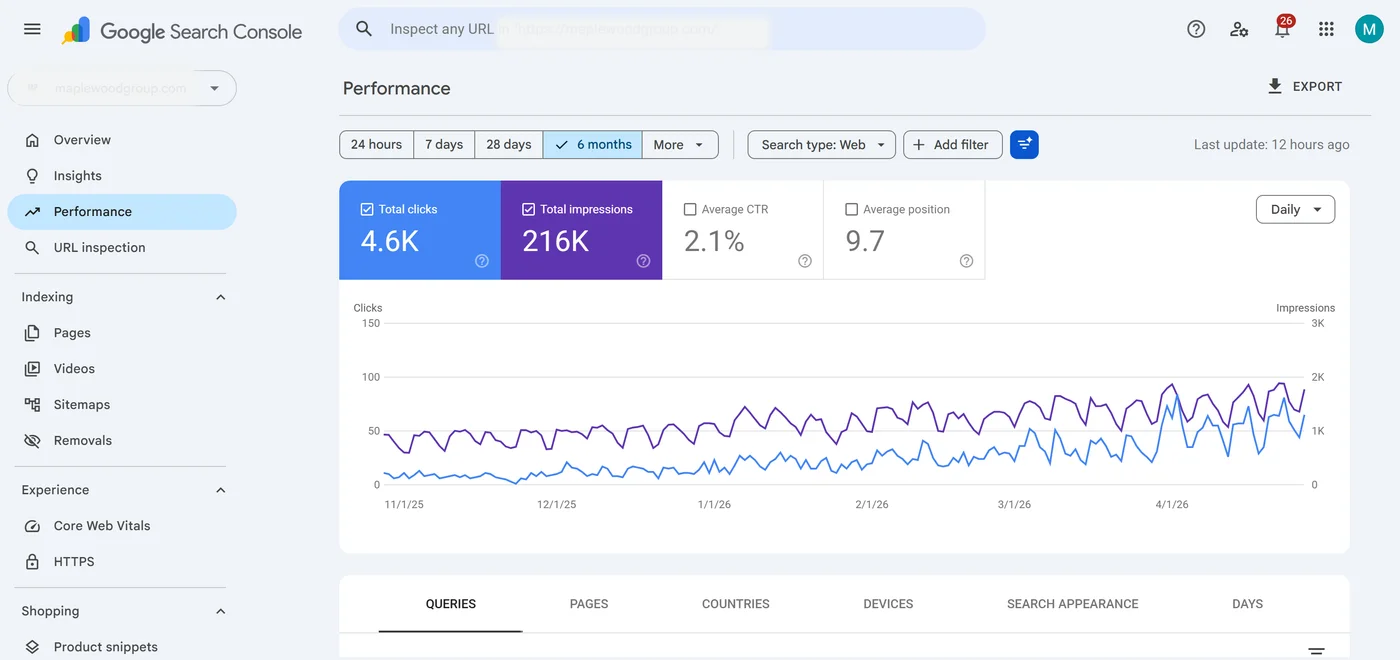
Sessions moved from 217 to 1,706 and tracked conversions from 9 to 80. Because this is a masked synthetic scenario, read the images and figures as one internally coherent campaign shape to compare with your own data. The post-pivot acceleration after month 5 is a planning signal, not proof that consolidation alone caused the change.
How Query Visibility Shifted
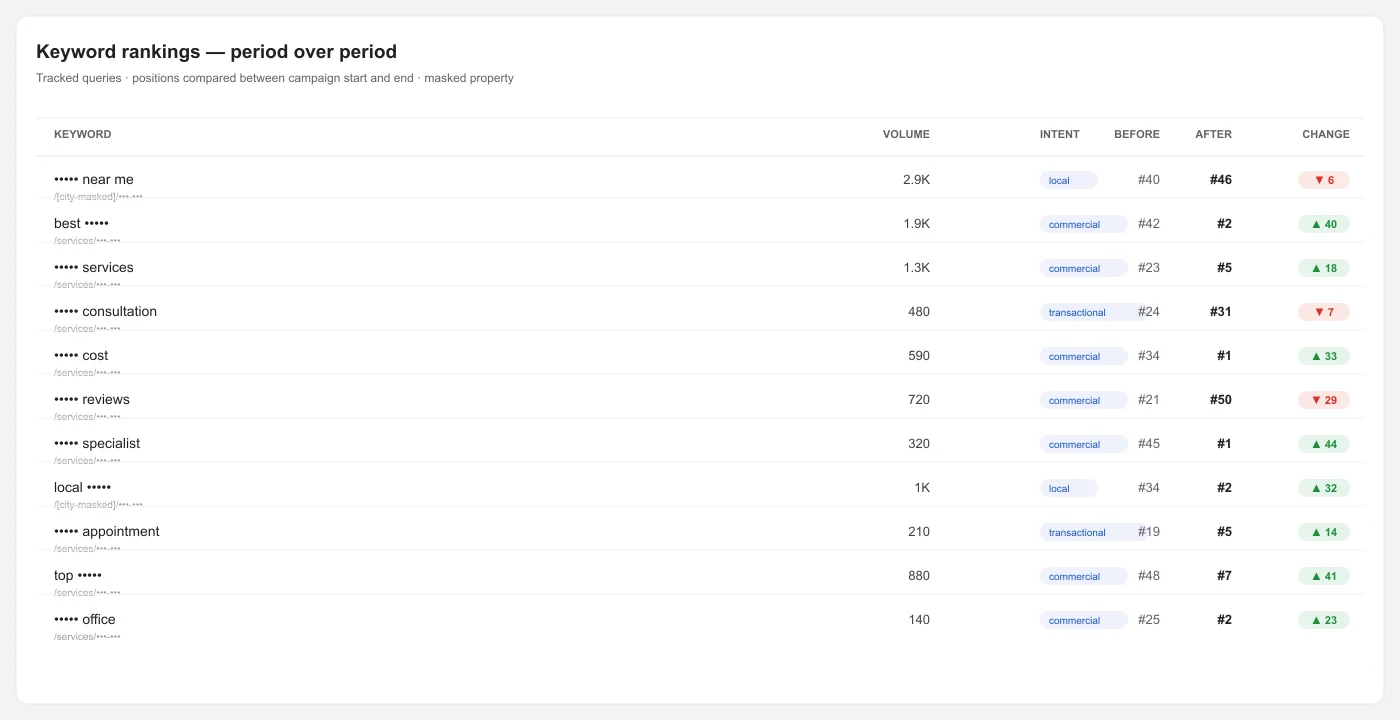
The query set shows a mix of strong gains, regressions, and nearly flat outcomes. That makes it more useful than a single headline average because it reveals which intents may deserve continued reinforcement and which need a different page strategy.
| Query structure | Intent | Volume | Before | After |
|---|---|---|---|---|
| best ••• | commercial | 1900 | 42 | 2 |
| ••• services | commercial | 1300 | 23 | 5 |
| ••• cost | commercial | 590 | 34 | 1 |
| ••• specialist | commercial | 320 | 45 | 1 |
| local ••• | local | 1000 | 34 | 2 |
| ••• appointment | transactional | 210 | 19 | 5 |
| top ••• | commercial | 880 | 48 | 7 |
| ••• office | commercial | 140 | 25 | 2 |
| affordable ••• | commercial | 590 | 45 | 4 |
| ••• fees | commercial | 480 | 30 | 5 |
| ••• guide | informational | 260 | 23 | 5 |
| ••• near me open now | local | 170 | 39 | 6 |
| ••• reviews | commercial | 720 | 21 | 50 |
| ••• consultation | transactional | 480 | 24 | 31 |
| ••• near me | local | 2900 | 40 | 46 |
| ••• experts | commercial | 390 | 46 | 48 |
The strongest recorded end positions cluster around pricing and comparison intents: cost at 1, fees at 5, and an affordable comparison at 4, against a starting average near 21. The reviews term ended at 50, the consultation term moved from 24 to 31, and the highest-volume local term with 2,900 searches moved from 40 to 46. By month 6, the experts term was still around 46 to 48. These mixed outcomes show why consolidation and prioritization should be judged by business relevance, not by whether every keyword improves.
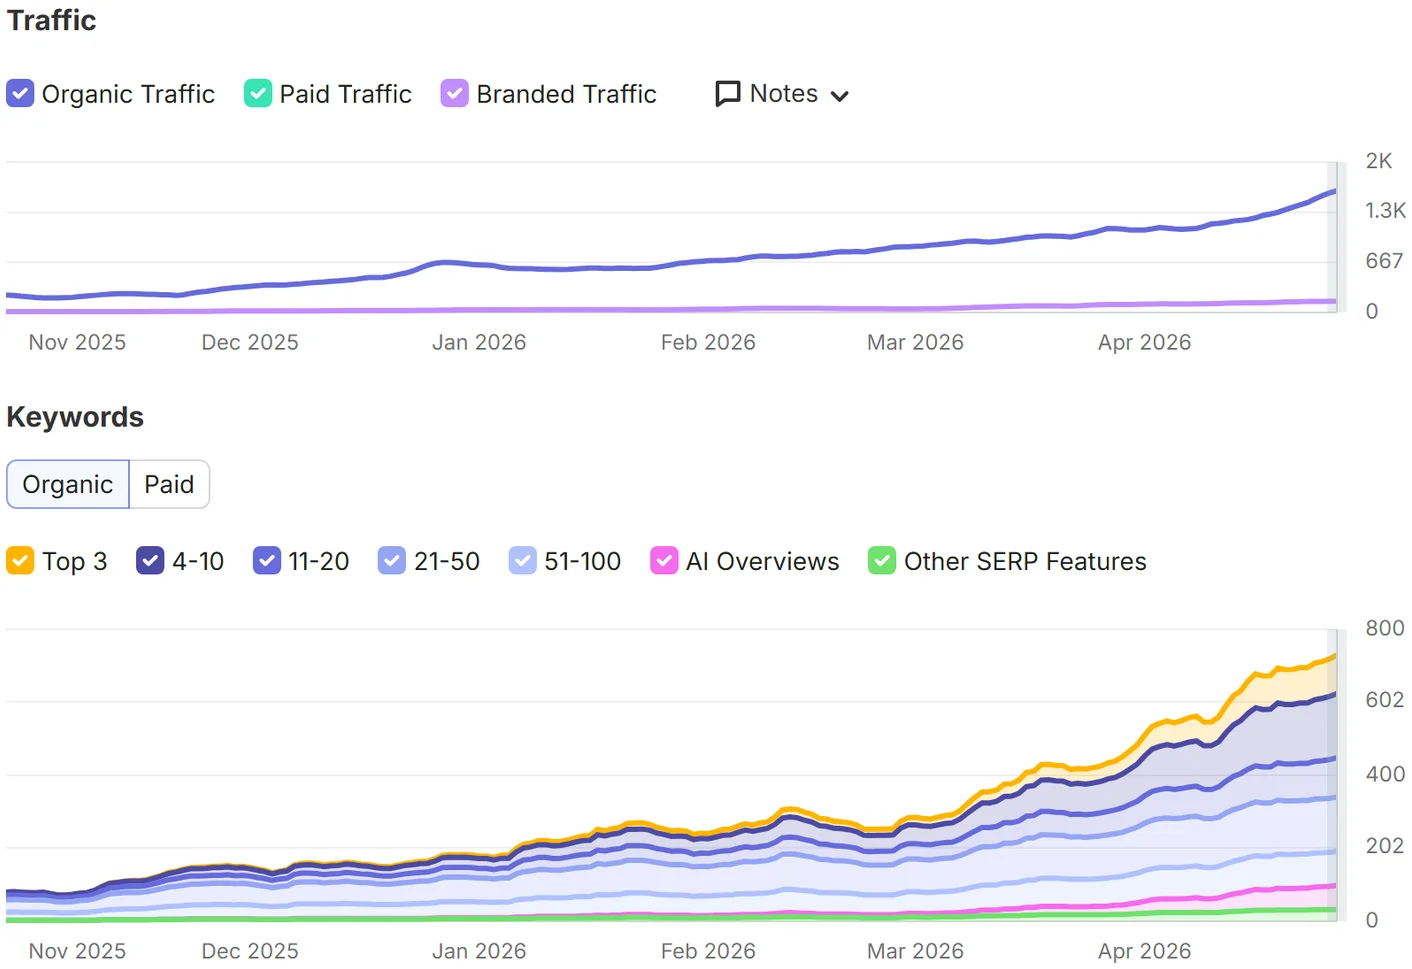
The third-party visibility graphic above belongs to the same modeled scenario; read it alongside the query table rather than on its own.
What the Movement Meant for Lead Generation
The business-facing metric in this scenario is qualified lead activity rather than raw traffic. Tracked conversions moved from 9 to 80 per month, while the modeled lead-value proxy moved from 2,250 to 20,000. The value figures use a modeled lead-value proxy rather than CRM close rates or accounting data, so replace the proxy with your own lead values before forecasting.
The support-content program recorded 31 articles across 8 clusters, while the internal topical-authority index moved from 23 to 65 and informational visibility reached 697 tracked keywords. The useful interpretation is that the agency created more entry points for people researching fees, process, provider comparison, and onboarding before they were ready to contact the firm.
That content can support lead generation when it reduces uncertainty and creates a relevant next step toward the commercial page. It should not be described as an automatic ranking or conversion engine, and the same caution applies to Google AI Overviews and other AI systems: clear entity information and direct answers may improve interpretability, but no citation or recommendation outcome is guaranteed.
Evidence Limits
This is a masked illustrative case study built from internally coherent synthetic metrics. It is not a verified third-party export, and private client identifiers are not represented.
- Some queries regressed. The reviews term ended at 50, while other local and consultation-oriented terms also remained weaker than the headline average.
- Timing overlaps. The month 6 end-state followed work completed in months 3 to 5, so attribution cannot be isolated cleanly by calendar month.
- External authority metrics are internal scenario observations. DR moved from 14 to 18; treat it as a third-party trend within the scenario, not a Google ranking factor.
- Local competition remained material. Page-level movement can be affected by market density, SERP layout, brand demand, and competitor changes outside the site's control.
The most defensible use of the case study is therefore procedural: compare what was changed, what improved, what regressed, and which evidence justified the next decision.
How to Interpret the Sequence
The six-month record is best read as an overlapping sequence rather than a controlled causal experiment.
Technical and structural work preceded most expansion. Average position moved from about 21 to 11 during the early stage, before the support layer was fully developed. That makes technical clarity a reasonable prerequisite, not proof of a guaranteed ranking effect.
Commercial destinations became more focused. Several tracked intents later appeared in positions 1 to 5, while the content program recorded 31 articles across 8 clusters and the internal topical-authority index moved from 23 to 65. Those observations support the value of clearer page ownership and useful support coverage without proving that one caused the other by itself.
Click capture improved alongside position. CTR moved from 0.9 to 3.5 percent and tracked conversions from 9 to 80. For decision-making, that means ranking changes should be judged by whether they bring qualified users to relevant pages, not by position alone.
The reinforcement pivot followed the plateau. The team changed emphasis in month 5 and observed further acceleration in month 6. That sequence can justify consolidation as a next action when page-level evidence supports it, while still avoiding a claim of guaranteed causation.
Practical Lessons
- Fix page ownership before scaling. Overlapping commercial URLs make it harder to understand which destination should answer each buyer intent.
- Use support content to answer real pre-sale questions. Useful coverage should reduce uncertainty and create natural internal paths toward the pages where prospects can evaluate the agency.
- Consolidate when breadth stops adding value. A plateau can be a signal to merge weak overlap and strengthen pages already contributing to enquiries.
- Report regressions as part of the evidence. A credible case study includes terms that worsened and explains the trade-offs without hiding them.
- Treat AI visibility as eligibility, not a promise. Clear, supportable answers may help systems interpret the agency, but no citation or recommendation outcome is guaranteed.
- Use the sequence, not the exact timing, as the transferable asset. The measured transition from stage 5 to stage 6 is specific to this scenario, while the decision logic can be adapted to another site.