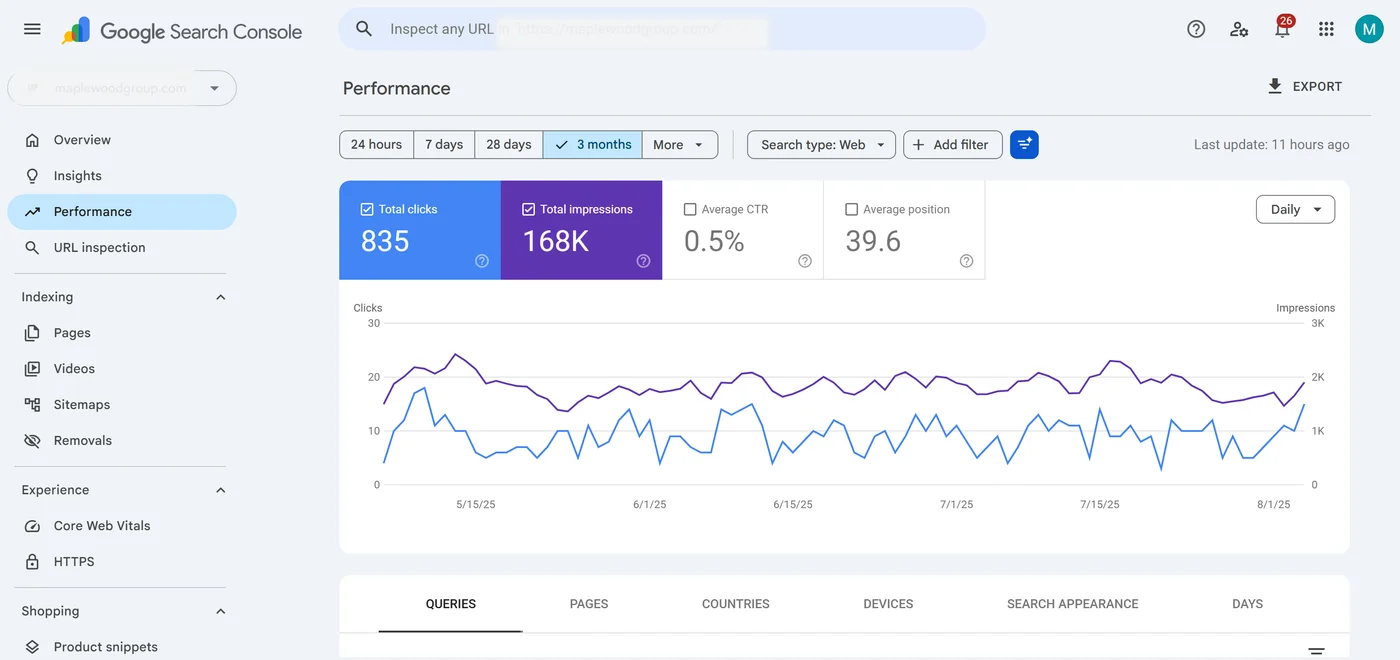
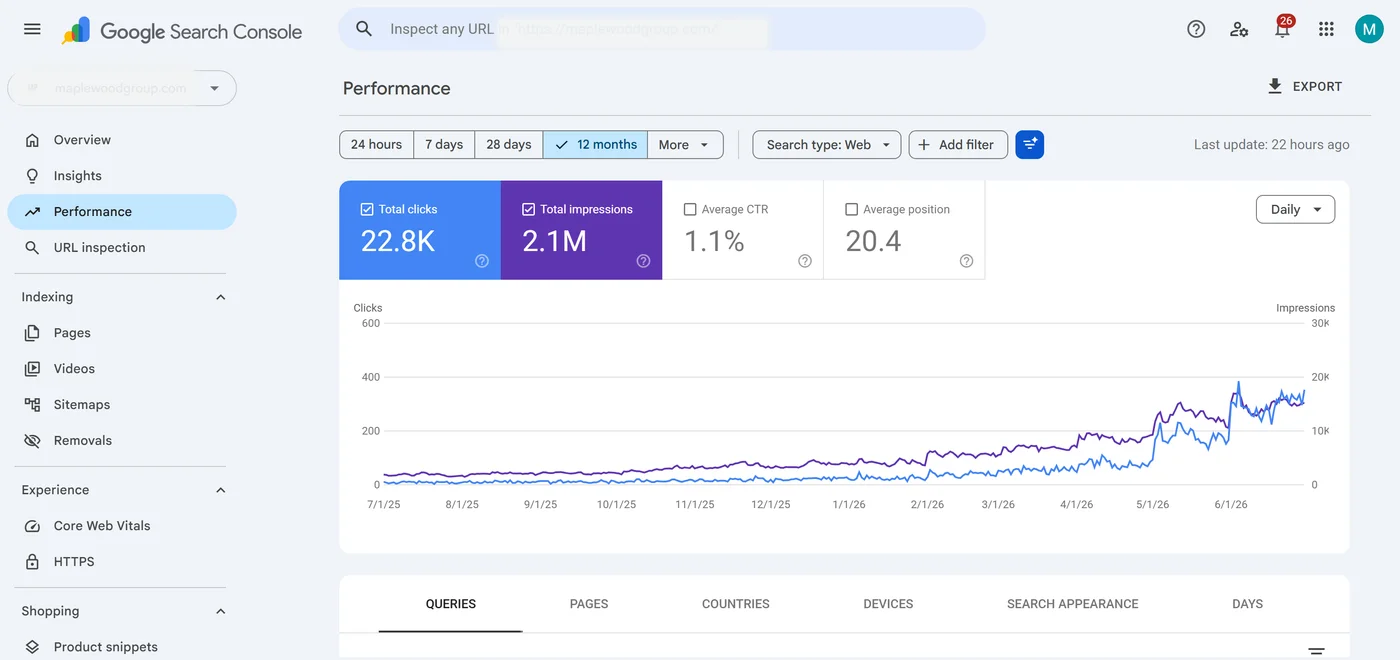
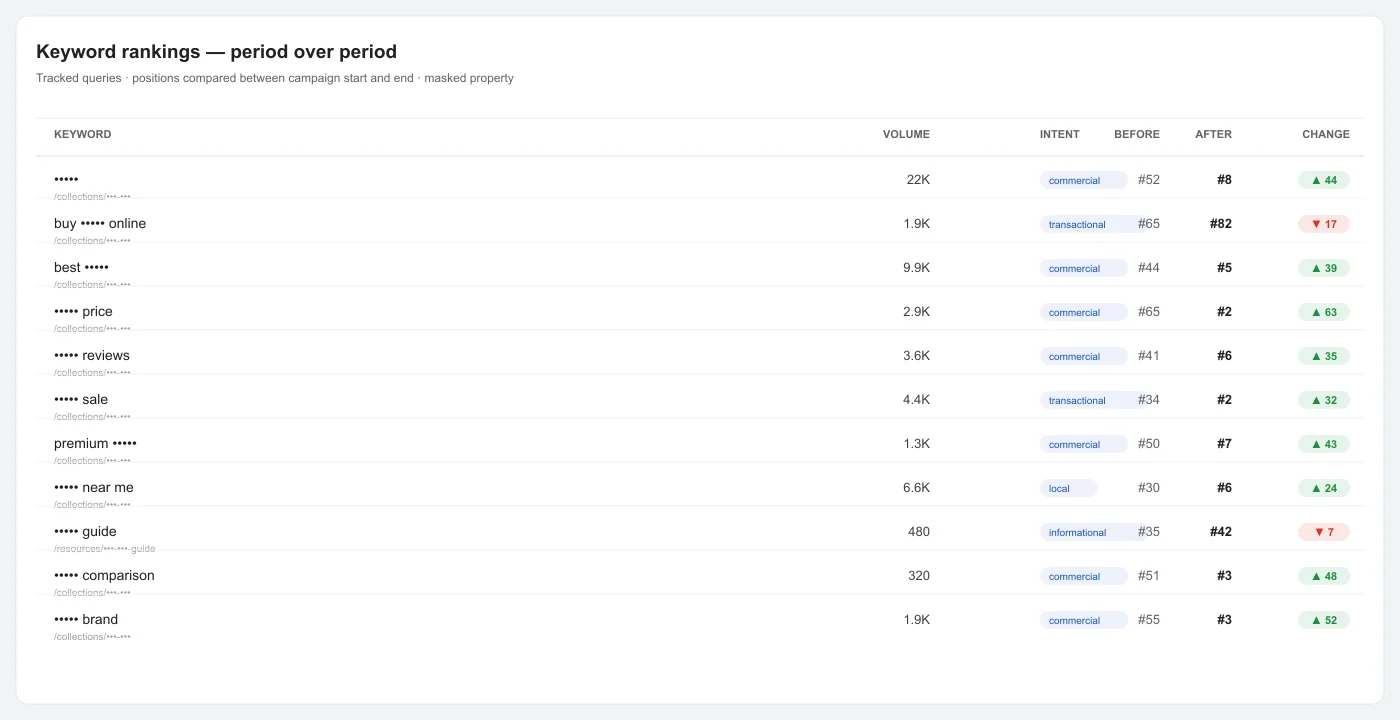
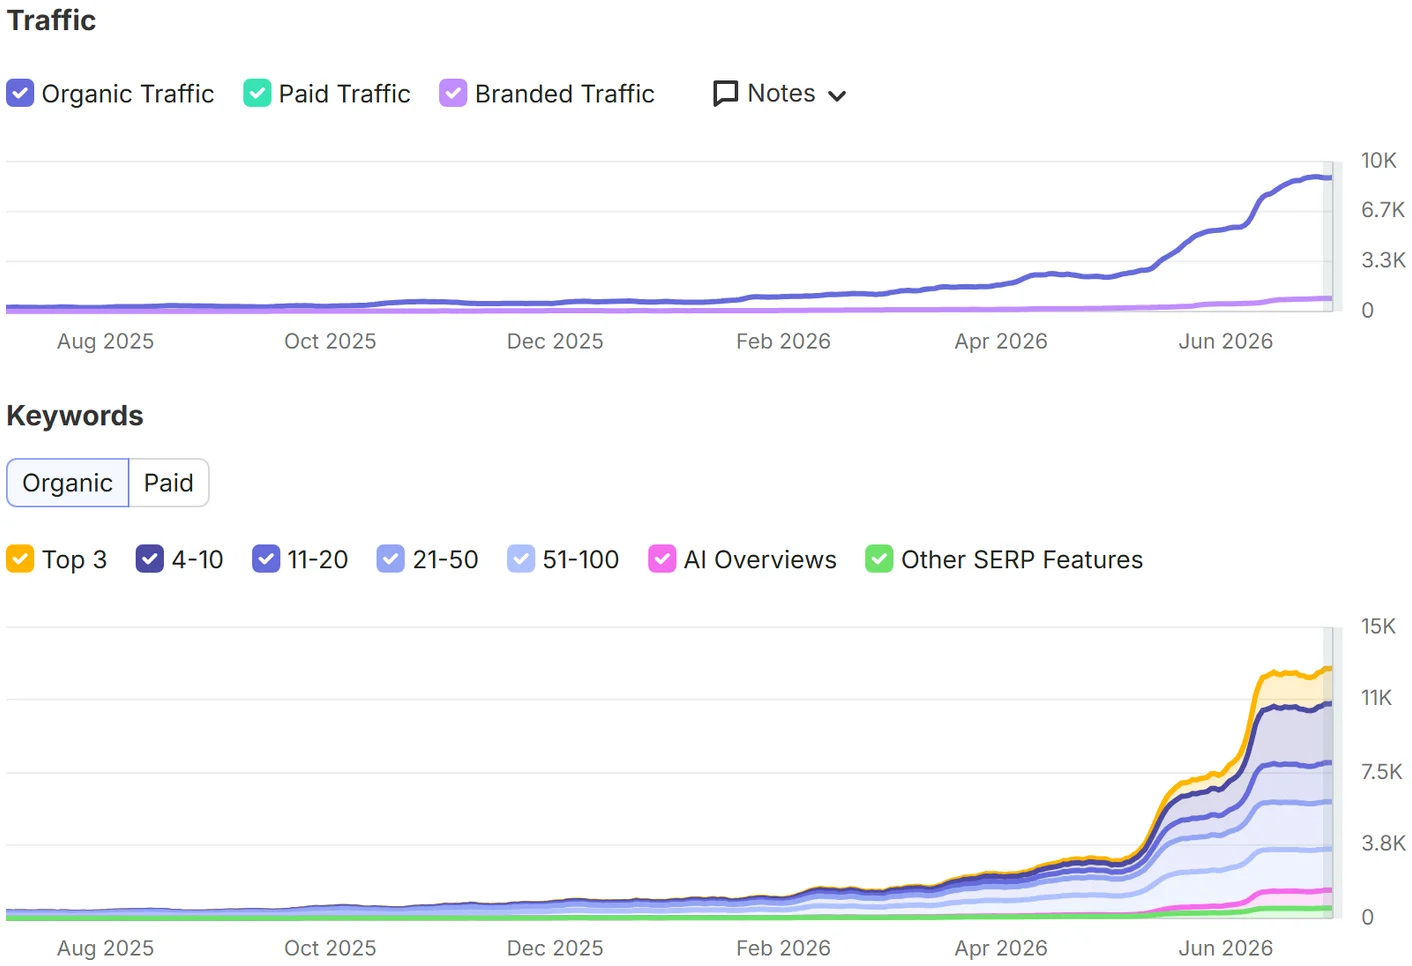
The timeline is useful because it separates foundation work, editorial restructuring, and later visibility movement instead of compressing everything into one before-and-after story.
Months 1 to 3: foundation and early publishing
Recorded clicks move from 277 to 325, while average position changes from 39.65 to 38.34. The cumulative article count is shown as 8, then 17, then 27, and the scenario's Domain Rating moves from 19 to 21. These numbers do not prove that the technical work caused a ranking change. They describe an early stage in which the store is still cleaning indexation issues, clarifying duplicated intent, and establishing the first useful content clusters.
For planning purposes, this stage is where expectations need to be defined carefully. Technical fixes can remove obstacles, but they do not guarantee immediate visibility. A retail team should use the period to verify whether priority pages are being crawled and indexed as intended, whether redirect and canonical decisions are correct, and whether new content answers questions that were previously uncovered.
Months 4 to 5: editorial and consolidation pivot
The scenario records 429 clicks with average position at 36.6, followed by 531 clicks at 36.0. The important change is operational rather than numerical: effort shifts away from maximizing publication count and toward consolidating overlapping intent, strengthening pages that have clearer commercial relevance, and redirecting only where a stronger destination genuinely replaces a weaker page.
That pivot is decision-useful because ecommerce teams often face a choice between expanding the catalog of indexable pages and improving the quality of what already exists. The case favors the second option when evidence shows that several URLs are competing for the same purpose. The move is not universally correct; it depends on whether the pages serve materially different shopper needs.
Months 6 to 8: broader visibility begins to appear
Average position moves below 34 as clicks reach 674, then changes to 31.9 with 740 clicks, then 27.0 with 1,189 clicks. Conversions move from 7 to 13 across this stretch. In the scenario, link recovery and relevant mention work begin after the underlying pages have already been strengthened. That ordering reduces the risk of using off-site activity to compensate for weak intent matching or poor internal architecture.
A real retailer should treat this stage as a measurement checkpoint. Look for whether the same commercial pages that gain visibility also attract relevant landing-page traffic, whether informational pages assist discovery of products or collections, and whether any ranking gains are concentrated in irrelevant queries. If visibility grows without qualified visits, the content and intent map may still need revision.
Months 9 to 12: later-stage compounding in the model
The modeled average position changes from 21.1 to 15.4, then 10.9, and finally 7. Clicks are recorded at 1,649, 2,345, 5,385, and 8,941. Conversions are shown as 22, 29, 74, and 103. The article total reaches 138, while the internal topical coverage index reaches 69.
The scenario describes those movements as compounding, but the safe interpretation is correlation within a synthetic model rather than proven causation. In a live clothing store, seasonality, assortment changes, merchandising, brand demand, competitor behavior, SERP composition, promotions, and technical releases can all influence the curve. The right use of this timeline is to understand sequencing and checkpoints, not to assume the same slope will repeat.