Supplement Brand SEO Case Study: How 93 Supporting Articles Accompanied an Order Increase From 6 to 43
A constrained publishing program paused in month 5 to merge competing collection variants; the recorded dataset later shows average position moving from 28.7 to 17 and monthly orders from 6 to 43.
Which parts of this supplement SEO program appear most useful when deciding what to fix first?
01Month 5 was used to reduce overlap rather than maximize output: net new publishing slowed to four pieces, then resumed, with the library reaching 93 articles by month 12.
02The strongest commercial movements happened while external authority changed more modestly: the head term moved from 19 to 5, the premium modifier from 40 to 4, and Domain Rating from 19 to 28. That makes consolidation and internal linking important factors to inspect, without treating the sequence as proof of causation.
03Not every intent improved. The price-oriented query moved from 41 to 47 and the store-style query from 31 to 46 after the thin pages serving them were redirected.
04Early ranking improvement did not immediately translate into more clicks: CTR remained at 0.7% while average position moved from 28.7 to 23.9. The useful operating lesson is to separate ranking-stage progress from click-stage progress once pages approach the top 20, and to remember that revenue here is modeled at 90 per order rather than audited transaction value.
Case Study at a Glance
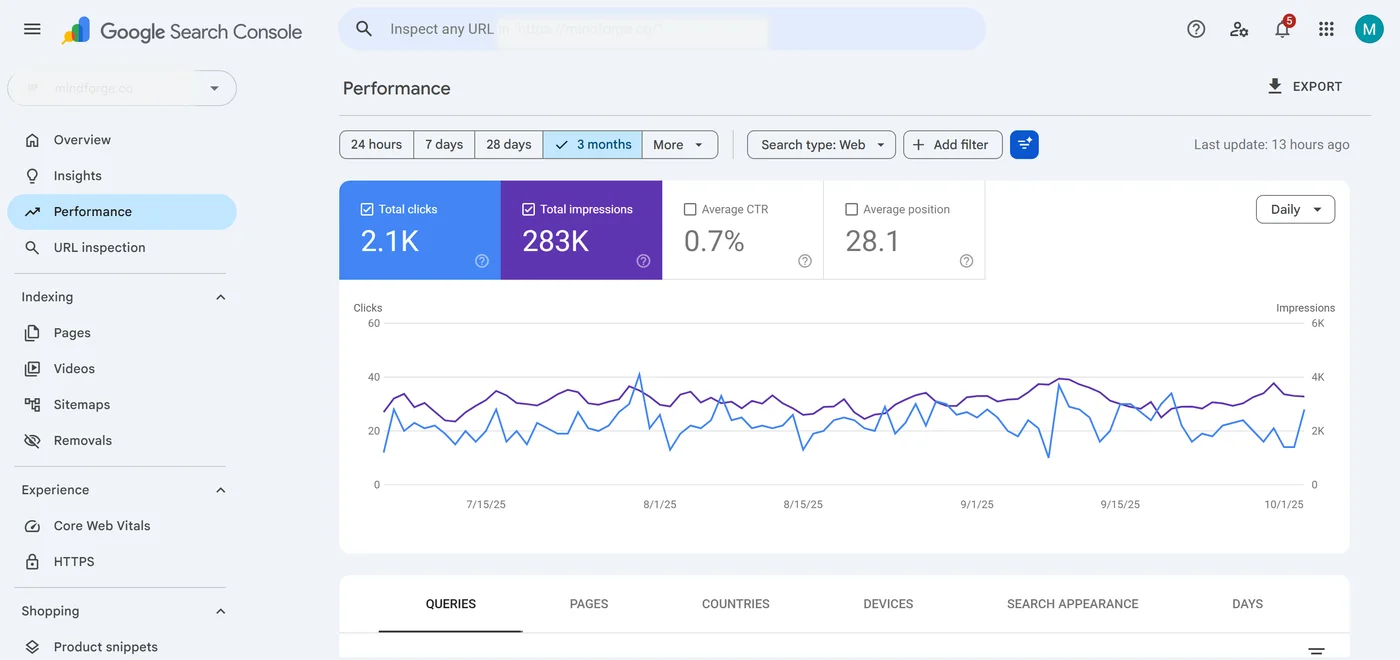
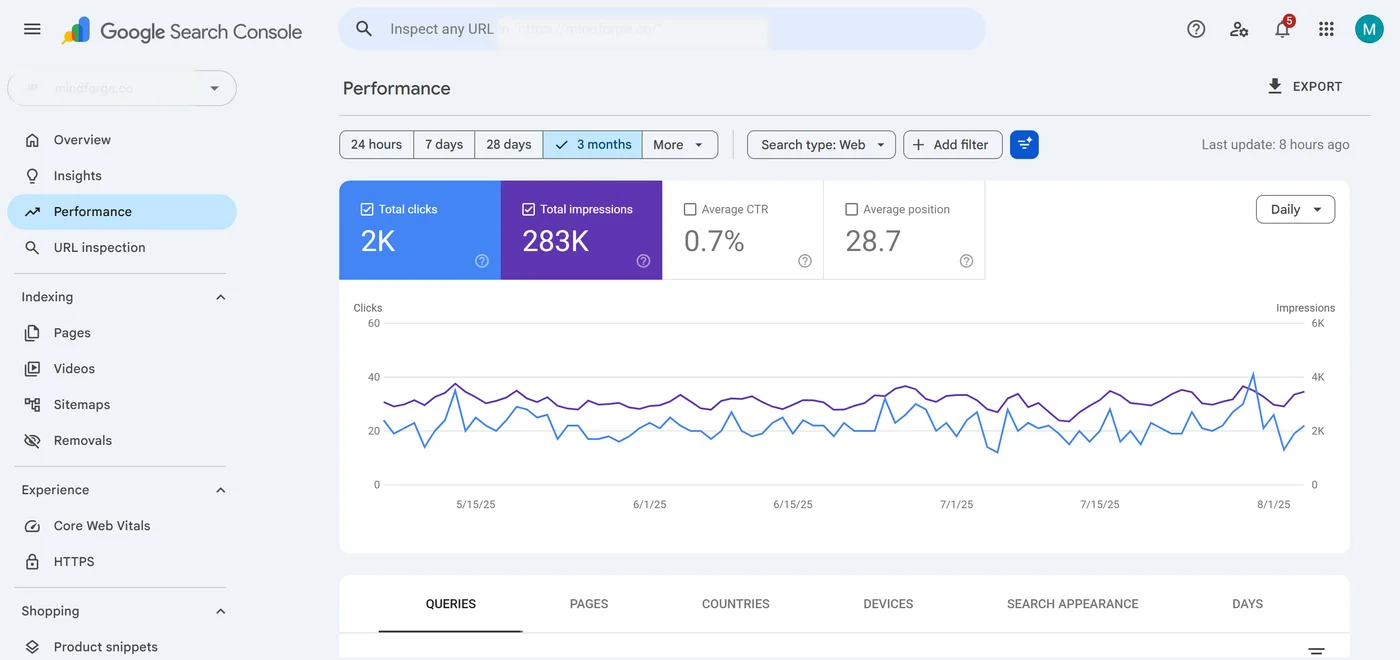
The baseline was a supplement ecommerce property with 93,374 impressions, 654 clicks, a 0.7% CTR, and an average position of 28.7. That is enough visibility to diagnose a discoverability problem, but not enough evidence to claim one tactic caused the weakness. The more useful question is where the site was fragmenting commercial intent and whether its supporting content gave shoppers useful reasons to move from research to a collection page.
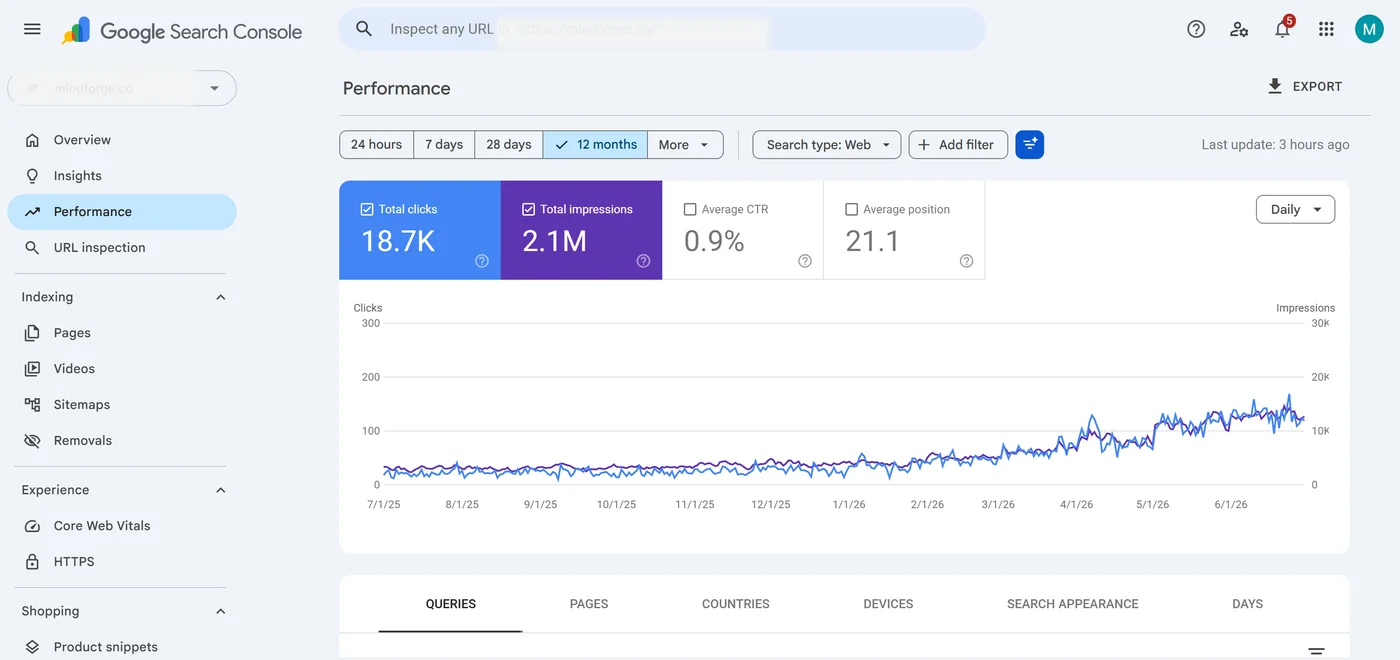
At the end of the observed period, the same dataset shows 388,255 impressions, 3,883 clicks, and 43 conversions in a month. The decision-useful lesson is the sequence: technical cleanup and consolidation came before scale, and a deliberate publishing slowdown was used to remove overlap before the library expanded again. Those facts make this a guide to prioritization, not a guarantee of a repeatable multiplier.
Starting Point and Constraints
The store sells supplements directly to consumers in a national retail market. Its catalogue was narrow enough that a single well-developed collection page could plausibly handle much of the shared commercial intent. At baseline, organic traffic produced 616 sessions and six conversions in month 1, with modeled value of 540 at the store's stated average order value.
The external authority profile was limited but not presented as penalized: Domain Rating 19, 25 referring domains, and 146 total backlinks. That matters because it limits how confidently any later ranking movement can be attributed to links alone.
The more obvious gap was information architecture. The internal topical coverage index was 21, while the existing blog content was not organized around buyer research paths or connected consistently to commercial pages. A reader researching ingredients, sourcing, timing, or safety could encounter content without a clear path to the collection that answered the purchase question.
Editorial capacity and claim discipline were the operating constraints. The store relied on an in-house writer and internal review for ingredient and outcome language. That makes sequencing especially important: every page added has a production cost, so duplicated intent and unsupported claims both create avoidable rework.
What Needed Fixing
The first decision was not 'publish more.' It was to identify where multiple URLs were competing for the same intent. The recorded map had 19 tracked commercial and transactional queries spread across overlapping collection and support pages. Several rankings sat between 30 and 40, while the price-oriented and store-style pages were recorded at 41 and 31. The head category term was at 19.
That pattern created a prioritization problem. If several thin pages are plausible candidates for the same query family, more content can amplify ambiguity instead of clarifying which page should represent the commercial topic. The practical response is to compare intent, page purpose, and internal links before deciding whether to merge, redirect, retain, or rewrite.
The second problem was the missing research layer. The site depended heavily on commercial pages while shoppers in this category often need ingredient, sourcing, timing, and comparison information before choosing a product. Supporting content can serve those questions and create natural internal paths, but it should not be treated as proof that a collection page will rank.
Finally, the crawl contained parameter and filter combinations that added avoidable URL clutter. Cleaning those patterns was an efficiency decision: reduce low-value URL duplication before investing scarce editorial capacity into pages that need to be discovered, indexed, and linked consistently.
What Was Changed
Months 1 to 2: clean the publishing surface
The first workstream was crawl and indexation triage. URLs returning 200 were classified by purpose, duplicate-generating parameter patterns were identified, and template-level canonical rules were reviewed so future catalogue changes would not recreate the same clutter. Redirect chains were shortened, internal status codes were checked, and collection rendering was reviewed for content that depended on client-side output.
Editorial governance ran in parallel. The store's approved language and regulatory guidance were sampled to define a claim boundary before production scaled. The purpose was practical: reduce avoidable reviewer rejection and keep ingredient copy within evidence the brand could support. That editorial system was intended to support a steady reviewed cadence with one writer and one reviewer, rather than make output volume the goal.
Months 2 to 4: consolidate commercial intent before expanding support
The query map was used to compare page purpose with the result types already appearing for each intent. Where separate collection variants overlapped, the strategy favored one primary commercial destination and redirected weaker variants after preserving any useful content. The surviving collection page was expanded with comparison context, sourcing detail, shipping and returns information, and reader questions relevant to purchase decisions.
The support plan then organized ingredient science and sourcing, dosage and timing, sports performance and recovery, sleep and stress support, gut health and digestion, immune support, women's health, men's health, third-party testing and quality standards, plus stacking, interactions and safety into topic clusters. Each support page was expected to answer its own question and, where useful, point readers to the relevant hub or collection page with descriptive anchor text.
For a site recorded at DR 19, internal relevance is one asset the team can directly control. That does not make internal links a guaranteed ranking mechanism. It does make a coherent information architecture preferable to a pile of disconnected posts.
Month 5: use editorial capacity to remove weak overlap
By month 4, the recorded article count was 27 and average position was 24.9, while sessions had moved from 616 in month 1 to 548. The team used that gap to audit older pages, duplicated topics, and orphaned URLs rather than assume more publishing was automatically the next step.
Net new output in month 5 was four pieces instead of the planned eight. Thin posts were merged into stronger hubs where appropriate, orphaned pages were either connected or retired, and the price-focused and store-style landing pages were redirected into the consolidated collection. Those decisions matter when reading the later declines for the intents those pages had previously served.
The entity layer was also standardized around the existing Organization and reviewer information, and short summary passages were added to hubs so the key answer could stand on its own without overstating evidence. For current Google AI features, no special markup requirement is implied here; the useful practice is simply to keep entity information and public claims internally consistent.
Months 6 to 12: resume production and watch the full system
The library later reached 93 articles by month 12. The internal topical authority index moved from 21 to 35, and about 2,256 informational keywords were recorded as ranking somewhere by the end of the period. Digital PR remained a supporting activity from month 4, while referring domains moved from 25 to 57. Those link metrics are observations from the case-study dataset, not evidence that a particular placement cadence is a ranking factor.
How the Recorded Timeline Unfolded
Quarter one: cleanup before visible growth
The first recorded click sequence was 654, 720, 680. Average position reached 26.9 in month 2 and returned to 28.7 in month 3. That is a useful reminder that consolidation can produce short-term instability while redirects and canonical choices are reprocessed; it should not be described as a guaranteed temporary dip or a guaranteed future recovery.
The operational milestone in this stage was cleaner indexation and the launch of the initial cluster structure, not a headline traffic result.
Quarter two: ranking movement appears before click movement
Month 4 recorded average position 24.9. Month 5 then showed impressions moving from 98,144 to 116,263. The important decision in this stage was the pruning pass, because it changed which URLs remained eligible to collect internal links and commercial intent.
The team deliberately used capacity for consolidation rather than maximizing the number of net new articles.
Quarter three: stronger click response
Month 7 recorded clicks moving from 816 to 1,085, CTR from 0.7% to 0.9%, and sessions to 1,077. Conversions moved from seven to twelve. The dataset is consistent with more pages reaching more visible positions, but it does not isolate a single cause for the change. The supporting architecture introduced in months 2 to 5 was already in place during this stage.
Month 8 recorded 154,338 impressions as additional cluster pages matured.
Quarter four: broader query coverage
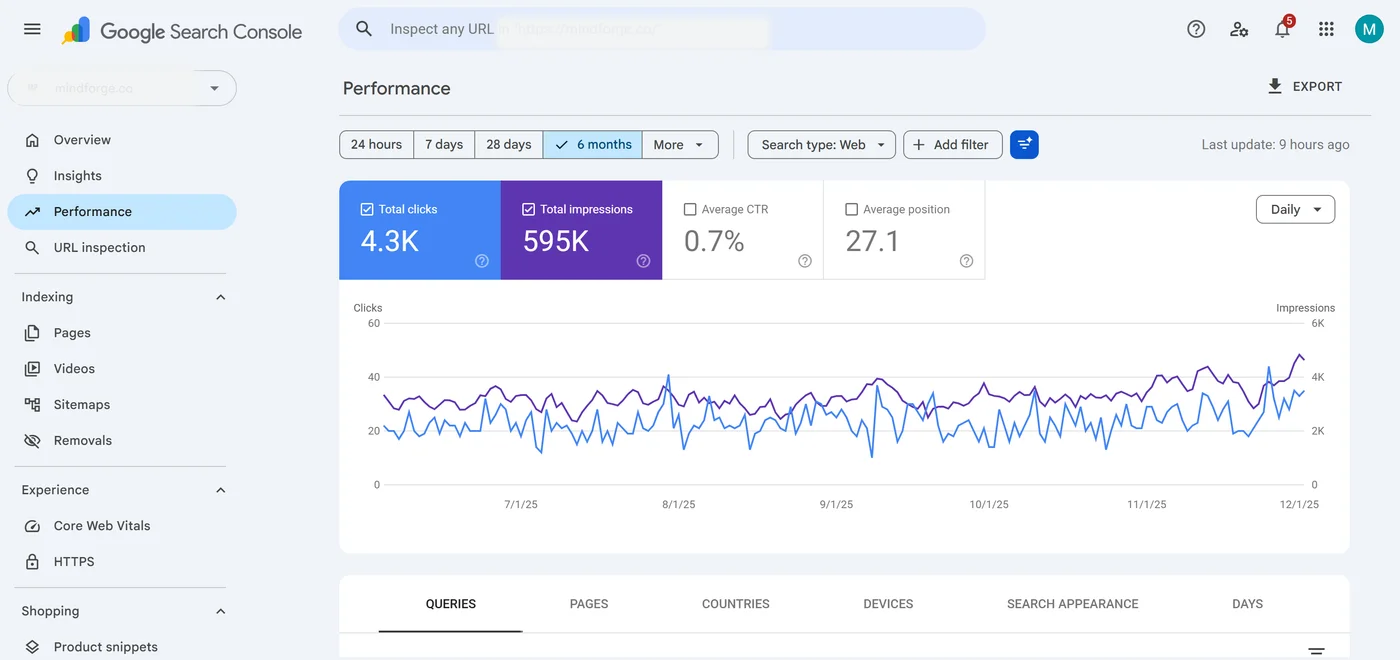
Across months 9 to 12, impressions were recorded at 193,420, 251,449, 340,824, and 388,255. CTR was approximately 1%, average position ended at 17.0, and conversions were 19, 27, 33, and 43. The library reached 93 articles, the internal authority index 35, and Domain Rating 28.
At that point the next decision was not simply to keep publishing. Updating high-traffic hubs, checking intent drift, and revisiting the knowingly sacrificed queries became more important than raw output.
What the Dataset Shows
The baseline view records month 1 at 93,374 impressions, 654 clicks, 0.7% CTR, and average position 28.7. The associated analytics record shows 616 sessions and modeled value of 540.
Month 12 records 388,255 impressions, 3,883 clicks, 1.0% CTR, and average position 17.0. The associated analytics record shows 3,720 sessions, 43 conversions, and modeled value of 3,870. The cumulative modeled organic revenue in the case-study dataset is 16,650. Because the brand is anonymized and the figures are presented as case-study measurements, they should be read as the dataset supplied here rather than independently verified transaction records.
How to read the movements
Visibility broadened faster than CTR changed. The recorded impression multiple is 4.2x and the click multiple 5.9x, while CTR ended at 1.0%. Average position ended at 17, leaving many impressions outside the highest-click positions; reaching position 8 is therefore a planning target in the original analysis, not an assured next outcome.
Conversion rate changed modestly. The case-study rate moved from 0.97% in month 1 to 1.16% in month 12. That supports monitoring traffic quality alongside volume rather than assuming every informational visit is equally valuable.
Authority metrics moved gradually. DR 19 to 28, referring domains 25 to 57, and total backlinks 146 to 273. These are observations, not documented ranking factors with a fixed causal effect.
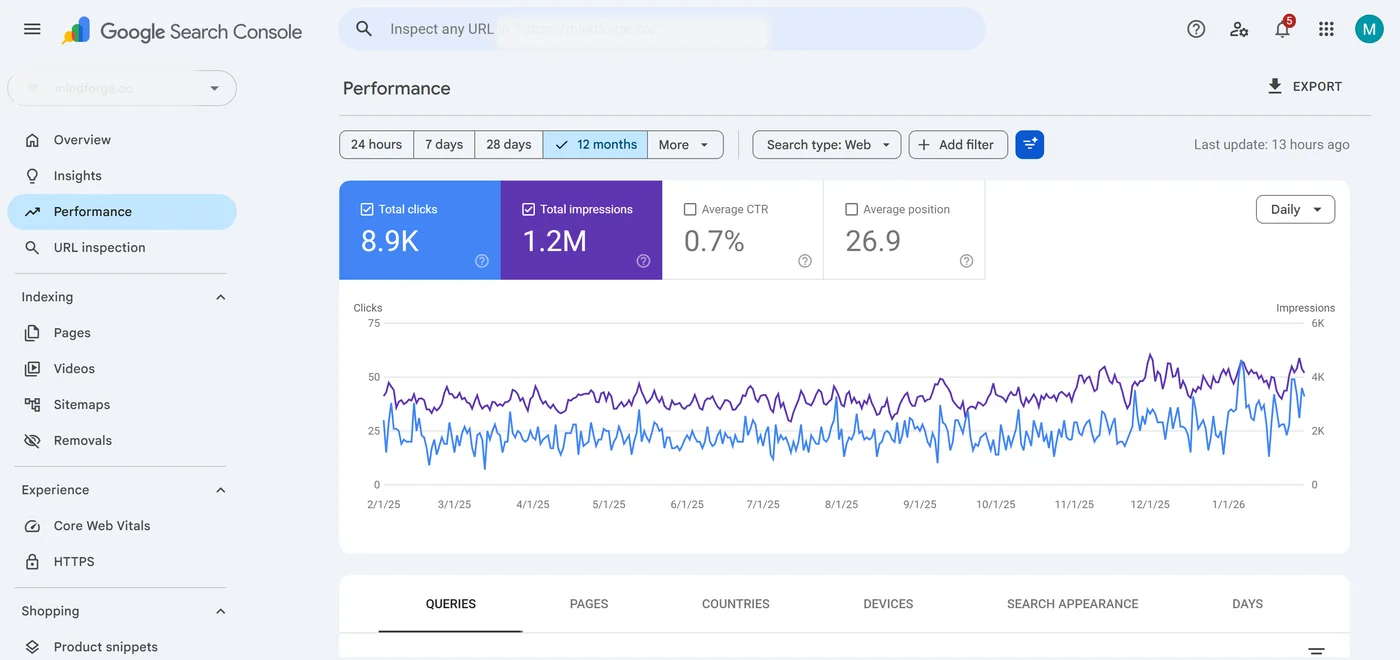
Analytics and Search Console are different measurement systems. Month 10 shows 2,514 clicks and 2,521 sessions; month 12 shows 3,883 clicks and 3,720 sessions. The correct operational response is reconciliation, not forcing the two systems to match exactly.
Which Search Intents Moved
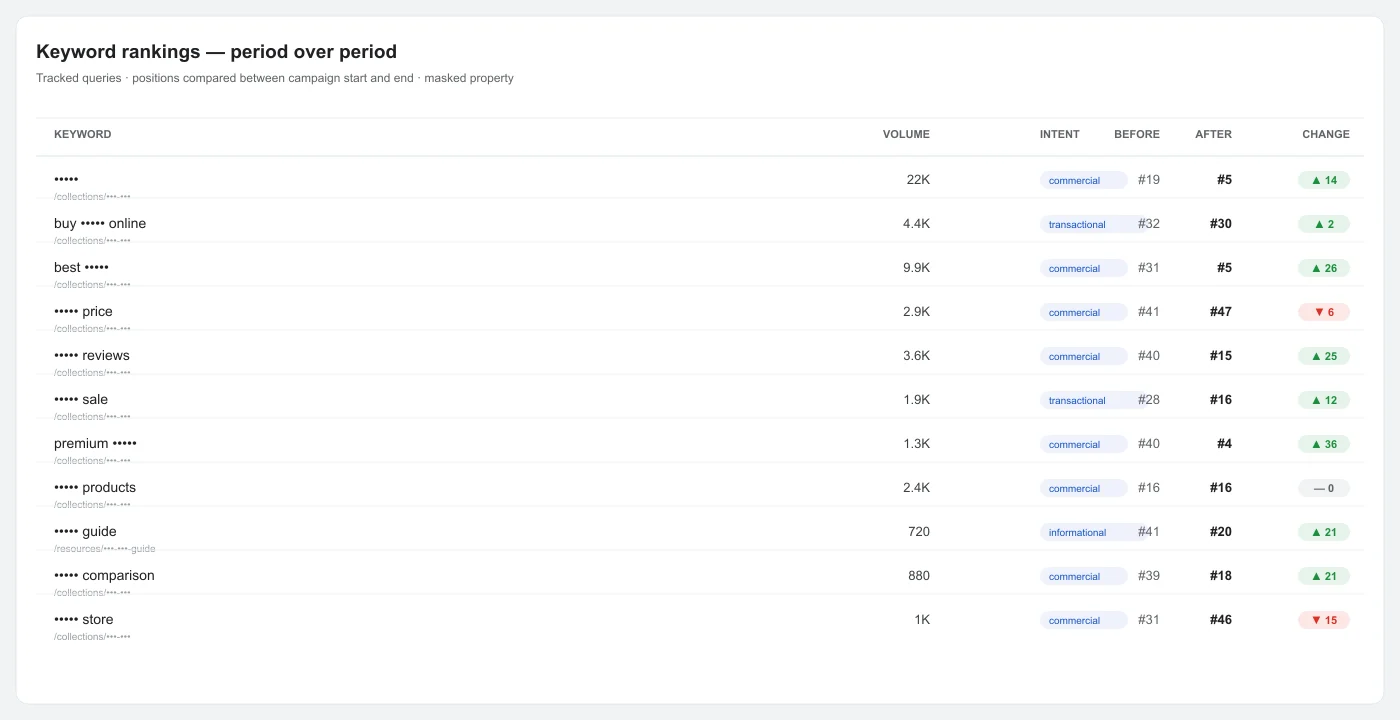
The table keeps the original masked query structures, demand values, intent labels, and recorded before-and-after positions. Use it to decide which intents appear compatible with the surviving page, which may need a different asset, and which should simply be deprioritized.
Query structure
Intent
Volume
Before
After
Change
Target page
•••
Commercial
22,000
19
5
+14
Money page
best •••
Commercial
9,900
31
5
+26
Money page
buy ••• online
Transactional
4,400
32
30
+2
Conversion page
••• reviews
Commercial
3,600
40
15
+25
Money page
••• price
Commercial
2,900
41
47
-6
Money page
••• products
Commercial
2,400
16
16
0
Money page
••• sale
Transactional
1,900
28
16
+12
Conversion page
••• discount
Commercial
1,600
40
8
+32
Money page
premium •••
Commercial
1,300
40
4
+36
Money page
••• store
Commercial
1,000
31
46
-15
Money page
••• comparison
Commercial
880
39
18
+21
Money page
••• guide
Informational
720
41
20
+21
Support guide
••• ingredients
Commercial
590
19
13
+6
Money page
••• subscription
Commercial
590
36
32
+4
Money page
••• ingredients sourcing
Commercial
480
21
7
+14
Money page
••• alternatives
Commercial
480
40
4
+36
Money page
Where the recorded gains concentrated
The largest upward movements were the quality-modifier query (40 to 4), the alternatives query (40 to 4), the discount query (40 to 8), and the reviews query (40 to 15). The useful interpretation is that the consolidated page contained more of the comparison and ingredient information those intents asked for. That association does not prove the page changes alone caused the rankings.
The head category term moved from 19 to 5 at a recorded volume of 22,000. Because multiple commercial URLs had previously overlapped, consolidation is a reasonable factor to inspect when diagnosing the movement, but the dataset cannot isolate it from all other work performed during the same period.
Ingredient and sourcing queries also moved: sourcing from 21 to 7 and ingredients from 19 to 13. Their placement supports keeping buyer-critical product evidence close to the commercial decision page rather than burying it in unrelated policy content.
Where the recorded losses remained
The price query moved from 41 to 47 and the store-style query from 31 to 46 after the thin pages that had served those intents were redirected in month 5. Those declines are important because consolidation trades breadth for focus. A store without physical retail should also avoid creating location-style pages that imply locations it does not genuinely operate.
The transactional purchase query moved only 32 to 30. At the recorded DR 28, the original analysis linked that difficulty to stronger marketplaces and retail aggregators; the safer conclusion is simply that this intent remained unresolved and would need a separate competitive assessment before choosing between content, links, marketplace strategy, or another response.
The catalogue-browse query stayed at 16 after ranging between 11 and 24, while the subscription query moved from 36 to 32. Those patterns are better treated as volatile or unresolved than forced into a success narrative.
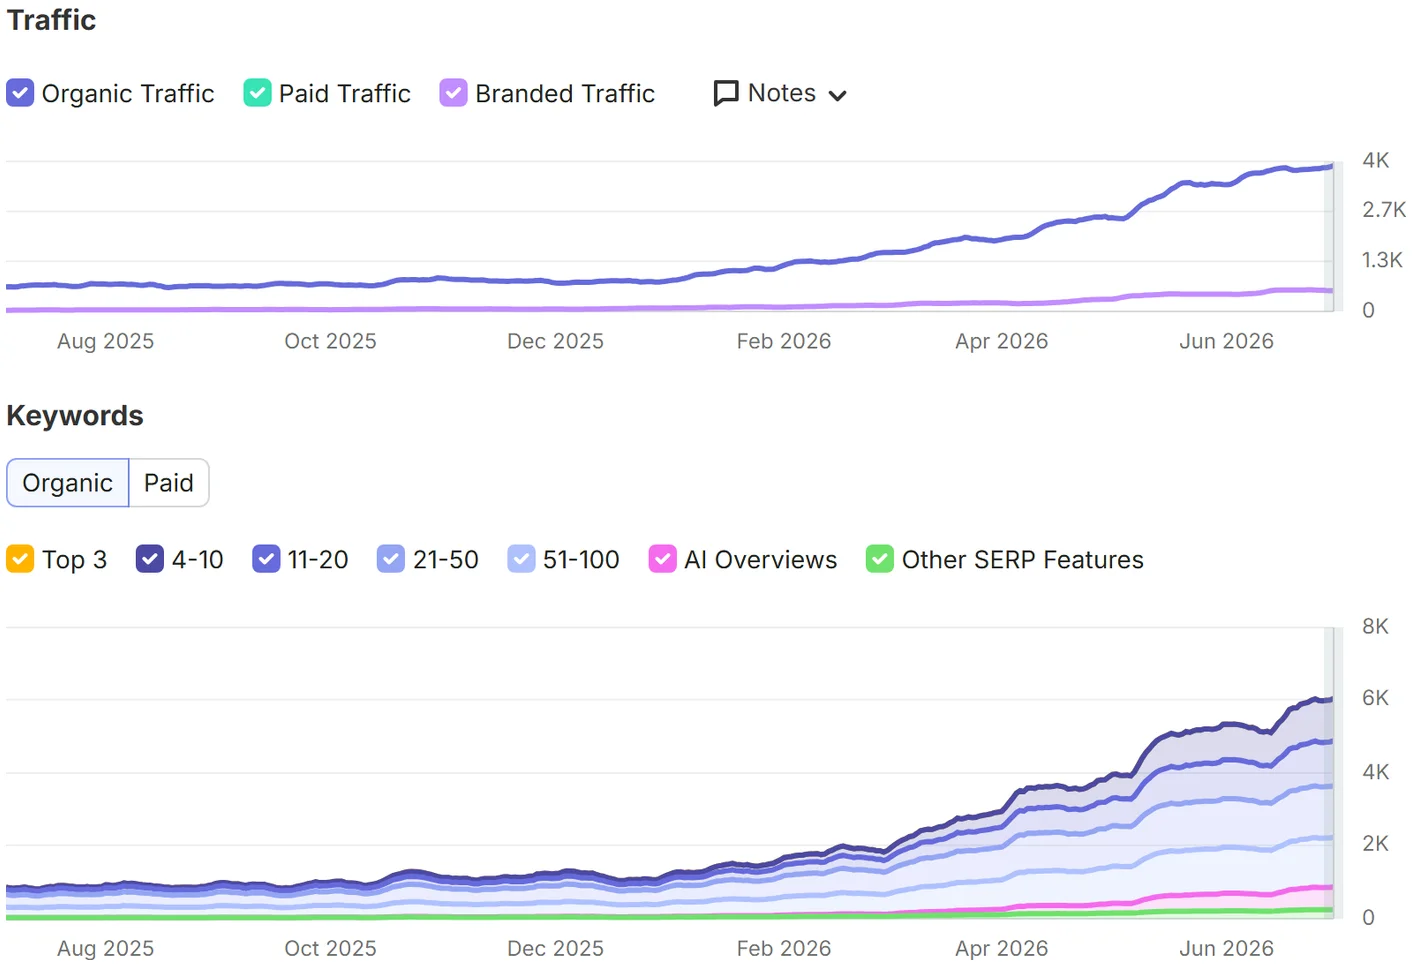
The external visibility estimate began rising near month 7. Use that as a directional cross-check only; the estimated curve is not a substitute for the Search Console record.
What the Changes Meant for the Store
The business record moves from 6 to 43 monthly organic conversions, with modeled value from 540 to 3,870 and cumulative modeled value of 16,650. The model counts first attributed orders and should not be treated as audited revenue or as a forecast of repeat-purchase economics.
At baseline month 1, organic demand was concentrated closer to purchase. By month 12, the site had a larger research library and more internal routes from informational pages to commercial destinations. The decision question for another supplement brand is therefore not 'how many articles should we publish?' but 'which buyer questions deserve durable pages, and where should those pages lead next?'
By the end of the period, the library contained 2,256 informational keywords with recorded visibility in month 12. Earlier in the final quarter, months 9 to 12, impressions rose from 193,420 to 388,255. Existing pages may have continued maturing during that period, but the dataset does not isolate that effect from seasonality or concurrent site work.
The cost profile also differs from paid acquisition. A published support library can continue attracting impressions without paying per click, but maintaining accuracy, claims, links, and product information still requires ongoing editorial work. That makes the library an owned content asset, not a free traffic guarantee.
For Google AI Overviews and other AI features, the sensible objective is clarity and evidence, not a special markup shortcut. This program used consistent organization and reviewer information plus answer-oriented summaries. The case study does not provide an AI citation count, so any AI visibility benefit should remain an unmeasured possibility rather than a claimed outcome.
The original work sequence from month 1 through month 5 set up the later library of 93 subject pages. The recorded organic session conversion rate moved from 0.97% to 1.16%. That modest change is useful because it keeps the analysis focused on qualified traffic and order behavior instead of treating pageviews alone as success.
What This Case Study Cannot Prove
The final-quarter slope needs context. Some clusters were still relatively new across months 9 to 12, and month 12 ended at average position 17.0. A longer observation window would be needed before treating that level as durable.
Revenue is modeled from order counts rather than audited payment data. It excludes the variation created by discounts, returns, subscriptions, and repeat purchases, so the absolute value should be treated as an estimate rather than accounting output.
Attribution is also incomplete. A reader may encounter several informational pages and later return through another channel, so a single-channel last-click view can both miss assisted value and over-credit some final organic visits.
Seasonality remains unresolved across months 10 to 12. The dataset records a strong back-half expansion, but it does not provide a controlled comparison that separates search work from market demand changes.
Search Console and analytics should not be expected to reconcile perfectly. Month 10 records 2,514 clicks and 2,521 sessions. Different measurement logic, consent, and sessionization can create gaps; the practical requirement is to understand the definitions before using either series for decisions.
The catalogue-browse term ranged between 11 and 24, while other intents remained unresolved. Those exceptions are useful because they prevent the case study from being read as uniform improvement across every query family.
Finally, this dataset does not measure citations or recommendation frequency in Google AI Overviews or other AI answer systems. Any discussion of AI visibility should therefore stay at the level of content clarity and entity consistency, not claimed performance.
How to Interpret the Sequence
Month 7 is useful as a checkpoint, but the sequence should be read as a set of plausible mechanisms rather than laboratory causation.
Technical cleanup reduced duplicated paths. Parameter and canonical cleanup made the site architecture easier to interpret and maintain. The case study does not prove that this alone improved rankings.
Consolidation concentrated commercial intent. The head term moved from 19 to 5 and the premium modifier from 40 to 4 after overlapping collection variants were reduced. That timing makes consolidation relevant to the diagnosis, while other concurrent work remains a confounder.
Supporting content broadened topical coverage. The internal authority index moved from 21 to 35, while 2,256 informational keywords were recorded with visibility. Those are coverage indicators, not official Google ranking metrics.
Internal links connected research to the commercial page. They created navigable relationships between support content and the collection. This is a site-architecture practice, not a guaranteed ranking formula.
More visible positions coincided with more clicks. Crossing into the top 20 was the stage highlighted in the original interpretation. CTR was 0.7% through month 1 to month 6 while average position moved from 28.7 to 23.9. In month 7, CTR was 0.9%, clicks moved from 816 to 1,085, and conversions from 7 to 12. That relationship is consistent with better visibility, although click behavior can also change with query mix and SERP presentation.
Traffic quality remained worth monitoring. The recorded session conversion rate moved to 1.16% from 0.97%. That is a modest change and should not be overstated.
The month 5 pruning step matters because it changed where internal links and commercial intent were concentrated. Its value is operational: remove pages that no longer deserve independent existence instead of asking every weak URL to compete forever.
External authority also changed, with 32 referring domains added across the period represented by the original analysis. The head term's recorded volume was 22,000. Those facts do not let the dataset assign a precise share of the outcome to links versus content, so the safest conclusion is that links were one concurrent input among several.
Decisions to Carry Forward
Consolidate overlapping commercial intent before scaling support. A library of 93 articles is easier to use when one primary collection page has a clear role.
Reserve capacity for pruning. Month 5 shows why a content program should be able to merge or retire weak pages instead of treating net new output as the only deliverable.
Separate ranking progress from click progress. Moving from position 30 toward position 20 may still leave CTR low, so report stage-specific milestones rather than promise traffic on a fixed schedule.
Keep losses visible. The recorded case includes queries that declined after consolidation. That is useful decision evidence because architecture changes can trade one intent for another.
Define claim boundaries before scaling regulated-category content. A review system reduces rework and helps keep supplement copy within the evidence available to the brand.
Measure the whole journey. The baseline CTR was 0.7% and the later record reached 1%; conversions, assisted paths, and commercial query movement matter more than article count alone.
Related service
See the strategy behind this result.
Explore the SEO strategy for ecommerce store businesses.
Why did the early cleanup not produce immediate traffic growth?›
The first stage changed which URLs were eligible to rank, so short-term instability was possible while redirects and canonical choices were reprocessed. In month 3, average position moved from 26.9 to 28.7; clicks were 654, 720, 680, and 687 across the early sequence. The first larger impression step appeared in month 5 and the stronger click response in month 7. Treat that timing as this case study's record, not as a standard SEO timetable.
Were 93 articles automatically better than 30?›
No. The decision was about coverage and structure, not a universal article quota. The internal topical authority index moved from 21 to 35 as the cluster library filled out, and months 8 to 12 coincided with impressions rising from 154,338 to 388,255.
That association does not prove that publishing more pages caused the growth; weak or overlapping content was also merged and pruned.
How should the link metrics be interpreted?›
They show a concurrent increase, not a clean causal attribution. Domain Rating moved from 19 to 28, referring domains from 25 to 57, and total backlinks from 146 to 273. The head term had recorded volume of 22,000 and moved from position 19 to 5.
Because consolidation, content, internal linking, and link work overlapped, the dataset cannot assign a precise share of that movement to backlinks.
Why are the declining queries still important to the case study?›
They show the trade-offs created by consolidation. The price-oriented query moved from 41 to 47 and the store-style query from 31 to 46 after the thin pages serving them were redirected. A supplement brand should keep a separate page only when that page serves a genuine user need the business can actually satisfy.
What would a next-stage SEO plan evaluate first?›
It would evaluate the gap from average position 17, the transactional query that moved from 32 to 30, and the modest conversion-rate change from 0.97% to 1.16%. Those signals point to three distinct questions: where stronger commercial relevance is still needed, where competition may require a different asset or authority profile, and whether informational visitors are reaching the right product path.
What does this case study support saying about AI visibility?›
Only that the site ended with 93 subject-specific pages plus consistent organization and reviewer information and answer-oriented summaries. The case study contains no measured citation frequency for Google AI Overviews or other AI systems, so it should not be used to claim an AI ranking outcome or a special markup requirement.
START A SECURE WORKSPACE
Start with a secure workspace.Build toward your Growth Report.
Secure SMS begins the path. Then confirm your email, create a password, add your workspace context, and complete your Growth Brief. Your Growth Report presents the available evidence and clearly marks what is still missing; Google connections remain optional.
Authority Specialist · Managed SEO
Need a team to carry the work through?
Explore our managed SEO approach, what an engagement covers and the current budget guide. No account is needed to review the service.
When you are ready to share your brief, create your free workspace. The proposed work, price and terms are reviewed before a paid engagement.