Mobile SaaS App SEO: How 92 Supporting Articles Moved One Product Page From Position 25 to 14
A constrained content program consolidated competing commercial URLs, then supported one product page with 92 articles across 10 clusters while qualified monthly conversions moved from 2 to 7.
Why accept a move from position 23 to 30 on the highest-volume query?
01Three overlapping commercial URLs were consolidated so one product page could carry the shared buying intent across 13 modifier queries instead of splitting signals across near-duplicates.
02The month 5 reset paused new commercial-page expansion and redirected content capacity into informational clusters; publishing slowed to 5 new pieces while the library moved from 27 to 32 cumulative pieces and average position moved below 21 for the first time.
03The generic head term and its software variant moved from 23 to 30 and from 22 to 30, while the developer API query moved from 35 to 33; these were treated as explicit trade-offs rather than hidden exceptions.
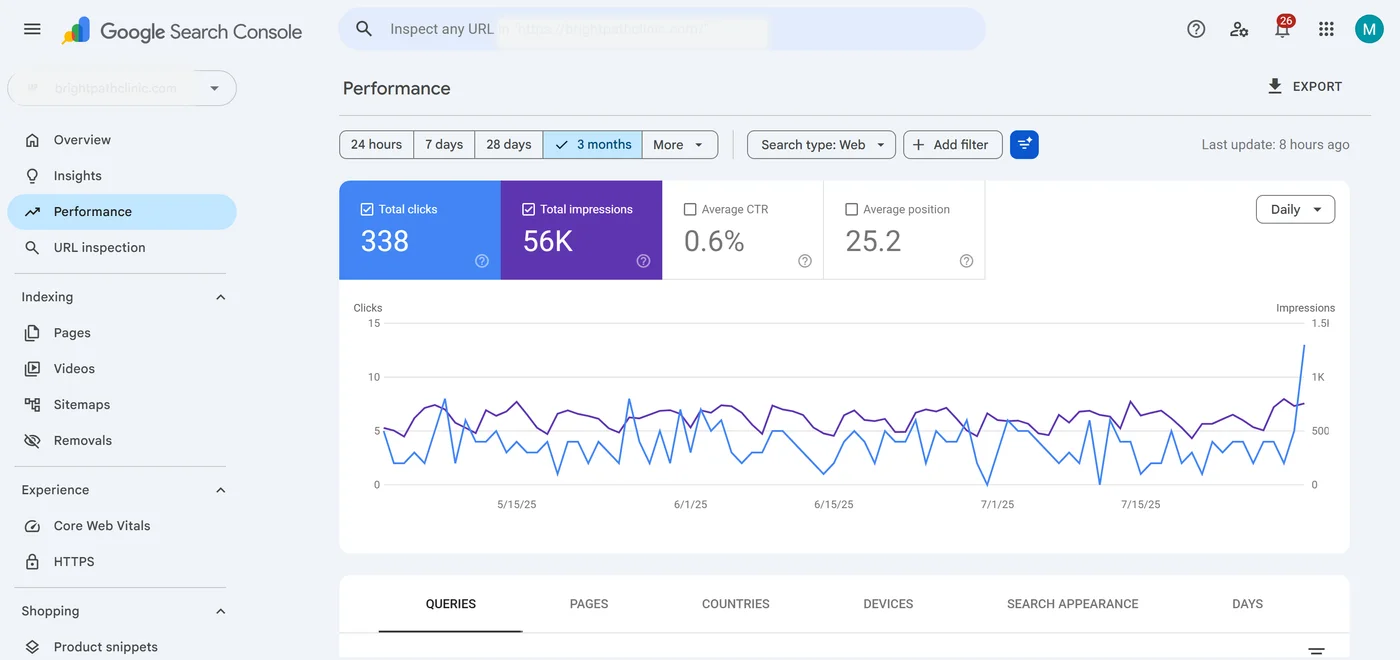
04The final month recorded fewer impressions, from 39,151 to 37,840, while clicks rose to 378 and CTR reached 1.0%, so the useful interpretation is improved query mix rather than assuming that raw impression volume alone defines success.
Case Study at a Glance
The useful decision in this case was not to defend every query. The product page ultimately traded visibility on a broad head term for stronger modifier intent, while qualified conversions moved from 2 to 7 over the observed period.
The broader change was architectural. A fragmented set of commercial URLs was replaced by one product destination supported by 92 informational articles across 10 clusters. The case study is therefore most useful as an example of choosing which intent a vendor page should own, then building the surrounding information architecture to support that choice.
Starting Point
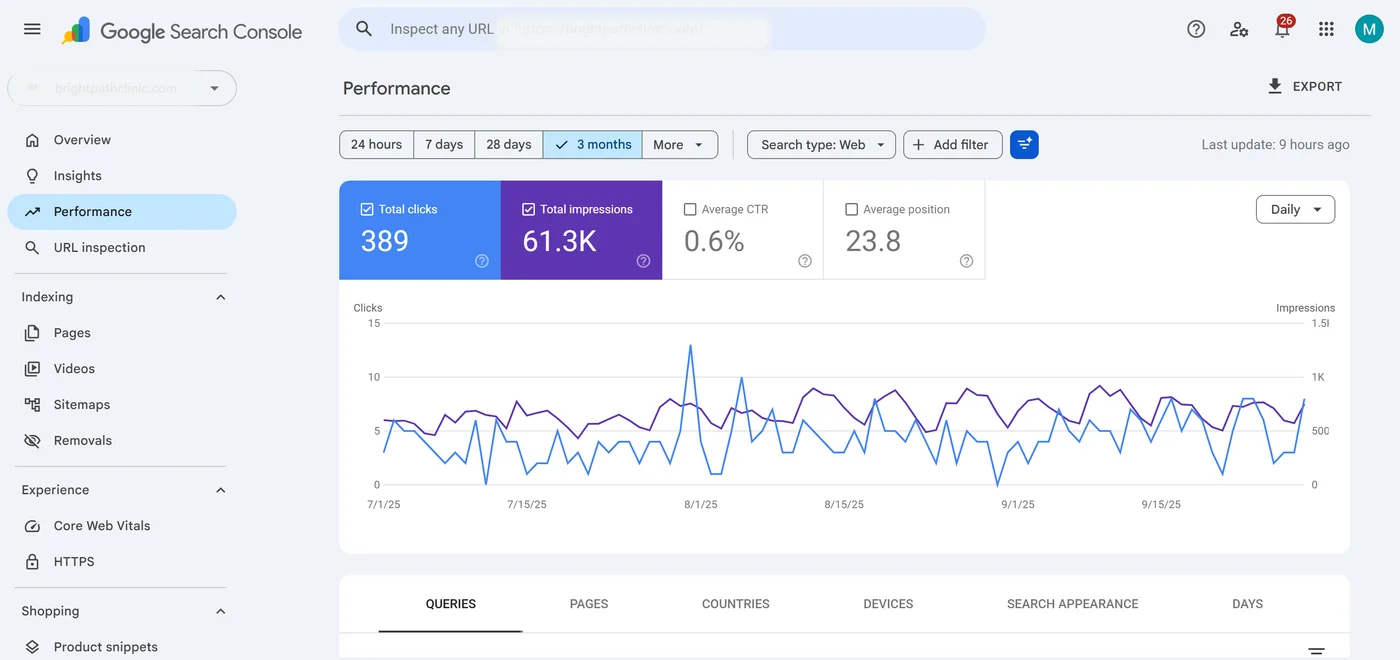
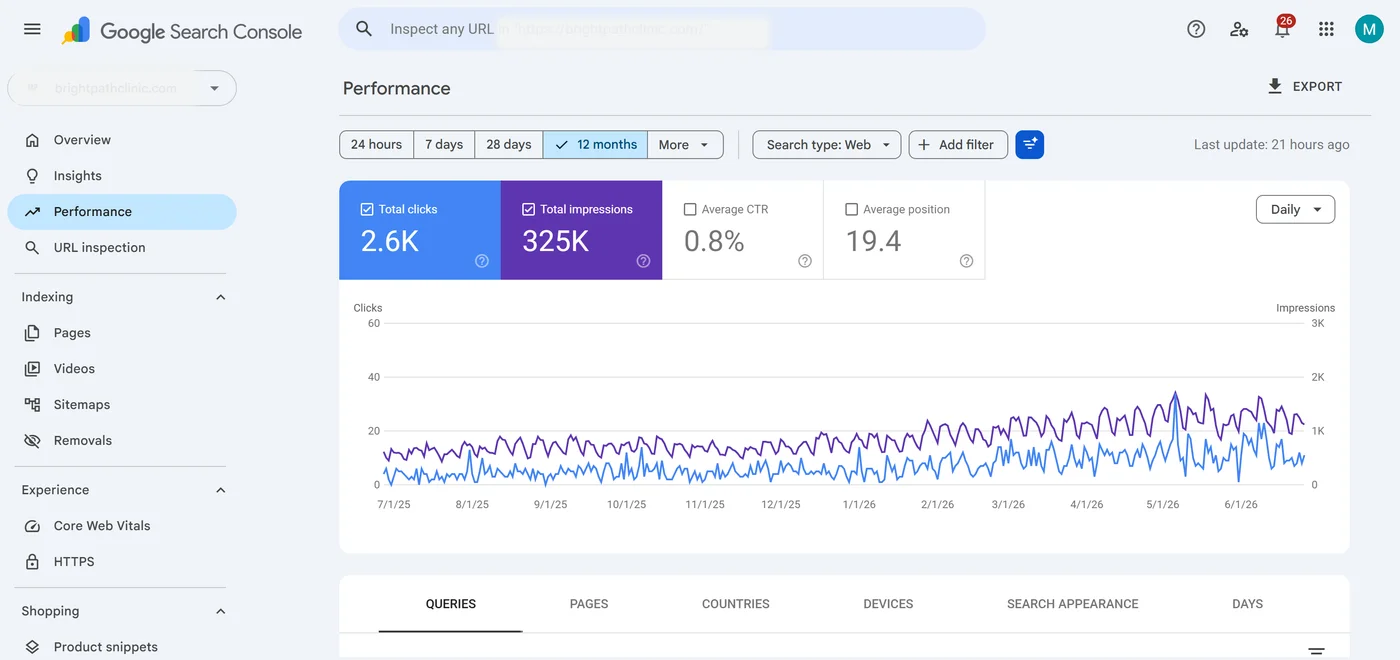
The client is represented as a mobile-first SaaS platform sold nationally to operations teams. At baseline, the site recorded 18,486 impressions and 111 clicks, a 0.6% CTR, and average position 25.2. Organic sessions were 94, with modeled monthly value of 600 based on roughly 300 per qualified demo or trial action.
The authority profile was modest: DR 18, 23 referring domains, and 166 backlinks. That context matters because it limits how confidently any later movement can be assigned to external links alone.
Editorial capacity was the binding operating constraint. One internal writer and a subject-matter reviewer meant the program had to choose topics carefully, while legal and product review limited unsupported comparative or capability claims. This made a broad competitor-comparison strategy less practical and put more weight on intent mapping, consolidation, and evidence-backed support content.
The crawl and ranking map showed that the same product destination was being asked to absorb a wide family of commercial queries while several thin variants competed around it. The core decision was therefore to simplify the commercial layer before increasing content volume.
What Needed Fixing
An average position near 25 hid several different problems. First, multiple commercial variants were addressing overlapping buying intent instead of giving the site one clear primary product destination.
Commercial-intent overlap
Comparison intent sat at 35, feature research at 19, integration research at 31, and team-fit intent at 32. The issue was not simply that the rankings were low; it was that near-duplicate URLs could all look like plausible owners for the same query family.
A shallow research surface
The site had only a small support layer, with one guide recorded at position 18, and the internal topical authority index at 17. Buyers in a SaaS category often research workflows, integrations, rollout, permissions, and procurement before requesting a demo, so the site had limited coverage of the questions that precede a vendor shortlist.
Indexation clutter
Parameter and listing variants plus legacy campaign pages created avoidable crawl and indexation noise. Cleaning these pages was a prerequisite to scaling because more publishing would otherwise have increased the number of weak or ambiguous candidates.
The broadest head term was handled as a separate strategic question. Manual review suggested the result set often favored directories and roundups over vendor product pages, so the program chose not to treat winning that query as the sole definition of success.
What Changed
The work was sequenced so the site became easier to interpret before the library expanded. The goal was not maximum output; it was to give each commercial intent a clear destination and each supporting topic a reason to exist.
Months 1 to 3: reduce ambiguity first
Indexation cleanup removed low-value resource variants, corrected canonical problems, collapsed a redirect chain ending in a 301, and fixed template duplication. The same audit also reviewed Organization and Service markup against the claims actually present on the site.
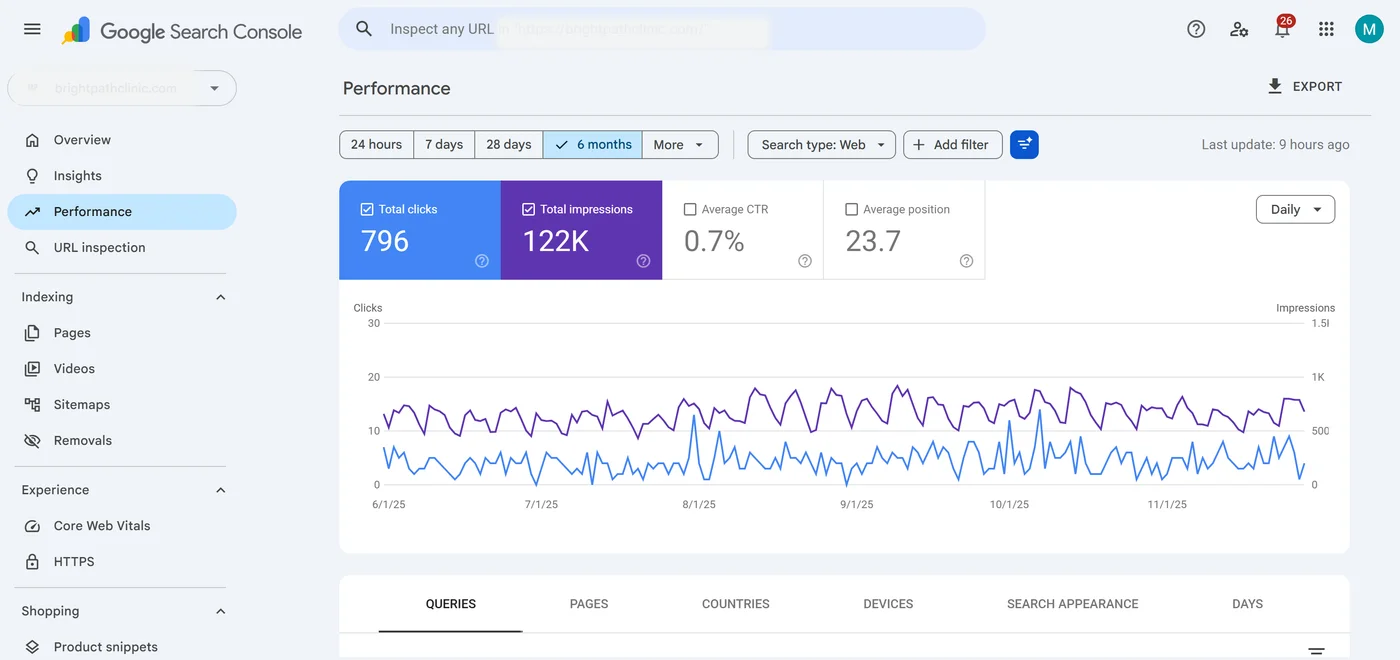
The query map then assigned each commercial intent to one owner. After consolidation, clicks moved from 111 to 148 while average position moved from 25.2 to 22.4. Because several technical and architectural changes were live together, those movements are best read as the recorded outcome of the stage rather than proof that one intervention alone caused them.
Month 5: stop expanding the commercial layer
The next stage was triggered by a stall. Clicks were 150 against 148, while average position moved from 22.4 to 24.0. Additional commercial briefs for integration and team-fit intent were cancelled because the consolidated page was already appearing for those queries and more overlapping URLs risked recreating the same ambiguity.
Cumulative publishing moved from 27 to 32 pieces while weak legacy pages were pruned and the content plan was reorganized around informational support.
Months 5 to 12: build support around buyer research
The library was organized into 10 topic clusters and reached 92 published articles. The internal-linking rule was simple: each support page had to answer its own question and link to the product page only where that destination naturally completed the reader's decision path.
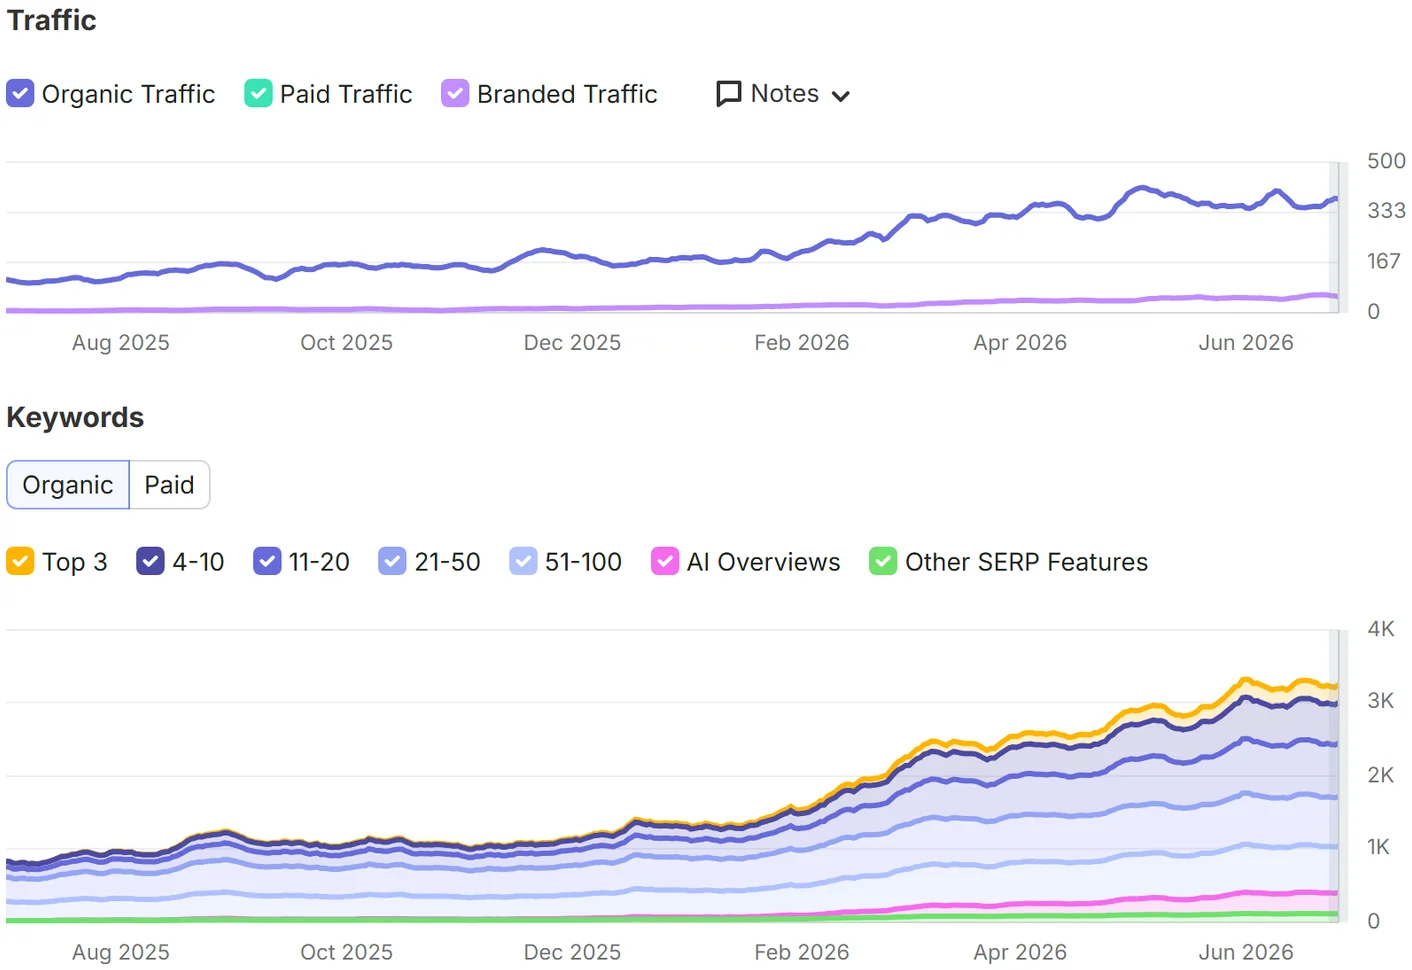
The end-state library contained 92 supporting pieces, while the internal topical authority index moved from 17 to 38 and the site recorded roughly 3,736 informational keywords. Those are scenario indicators of coverage, not official Google ranking metrics.
Links and editorial controls remained supporting workstreams
Referring domains moved from 23 to 57 and DR from 18 to 30 as lost links, citations, and relevant resource placements were addressed. Links moved alongside the content and consolidation work, so plan them as one concurrent input rather than assigning them a fixed causal share.
Editorial QA also checked capability claims against approved product documentation before publication. That control mattered because SaaS content can become misleading quickly when roadmap features, integrations, or performance claims are described more strongly than the product evidence supports.
Recorded Timeline
Phase one: months 1 to 3, stabilization
Clicks moved from 111 to 148, impressions from 18,486 to 21,111, while qualified conversions stayed at 2. The stage was primarily about reducing duplicate commercial intent and making the crawl and indexation picture easier to interpret.
Phase two: months 4 to 5, correction
Impressions were 19,887 and average position 21.4. Instead of responding with more overlapping commercial pages, the program used the slowdown to prune weak URLs and redirect future production toward informational clusters.
Phase three: months 6 to 8, broader query coverage
Clicks moved through 155, 171, and 232. Impressions rose from 24,382 to 29,039 while average position reached 20.5. Qualified conversions moved to 3 and then 4. Link recovery and cluster publishing overlapped in this phase, so the case does not support assigning the inflection to one cause.
Phase four: months 9 to 12, compounding coverage
Average position moved through 16.4, 15.5, 14.6, and 14.0. Clicks were 295, 311, 352, and 378. CTR reached 1.0%, while qualified conversions were 5, 6, and 7 in the later sequence. The impression series peaked at 39,151 before ending at 37,840, so the final month is better interpreted through query quality and click behavior than through impression count alone.
Results and Evidence
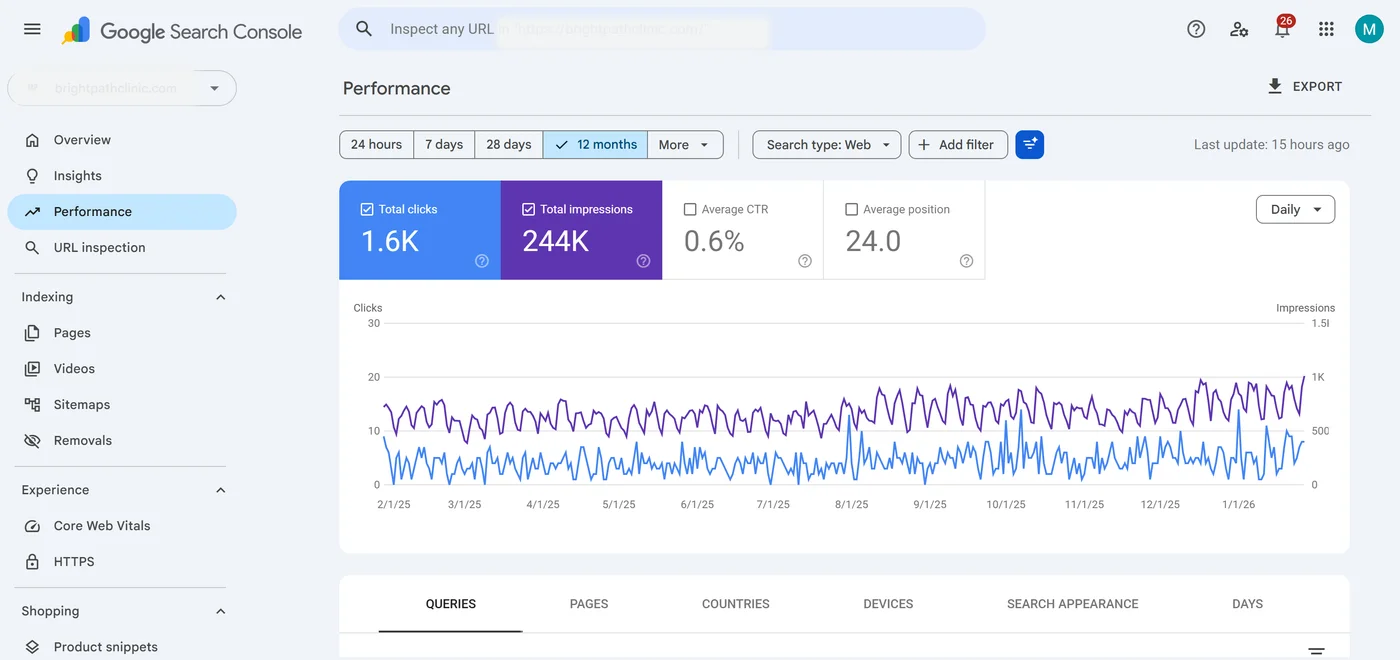
The recorded start-to-end comparison is useful because it separates visibility, click behavior, traffic, qualified actions, and authority context.
Clicks: 111 to 378
Impressions: 18,486 to 37,840
Average position: 25.2 to 14.0
CTR: 0.6% to 1.0%
Organic sessions: 94 to 281
Qualified conversions: 2 to 7
Modeled monthly value: 600 to 2,100
Authority context: referring domains 23 to 57; DR 18 to 30; backlinks 166 to 310
The baseline view shows a relatively broad impression base but limited click-through, consistent with many rankings sitting outside the most visible result positions.
Across the scenario, clicks grew 3.4x while qualified conversions grew 3.5x. That parallel movement means conversions kept pace with traffic. Closed-won CRM attribution and a controlled counterfactual were not part of the tracking, so judge account value with your own sales data.
Keyword Movement
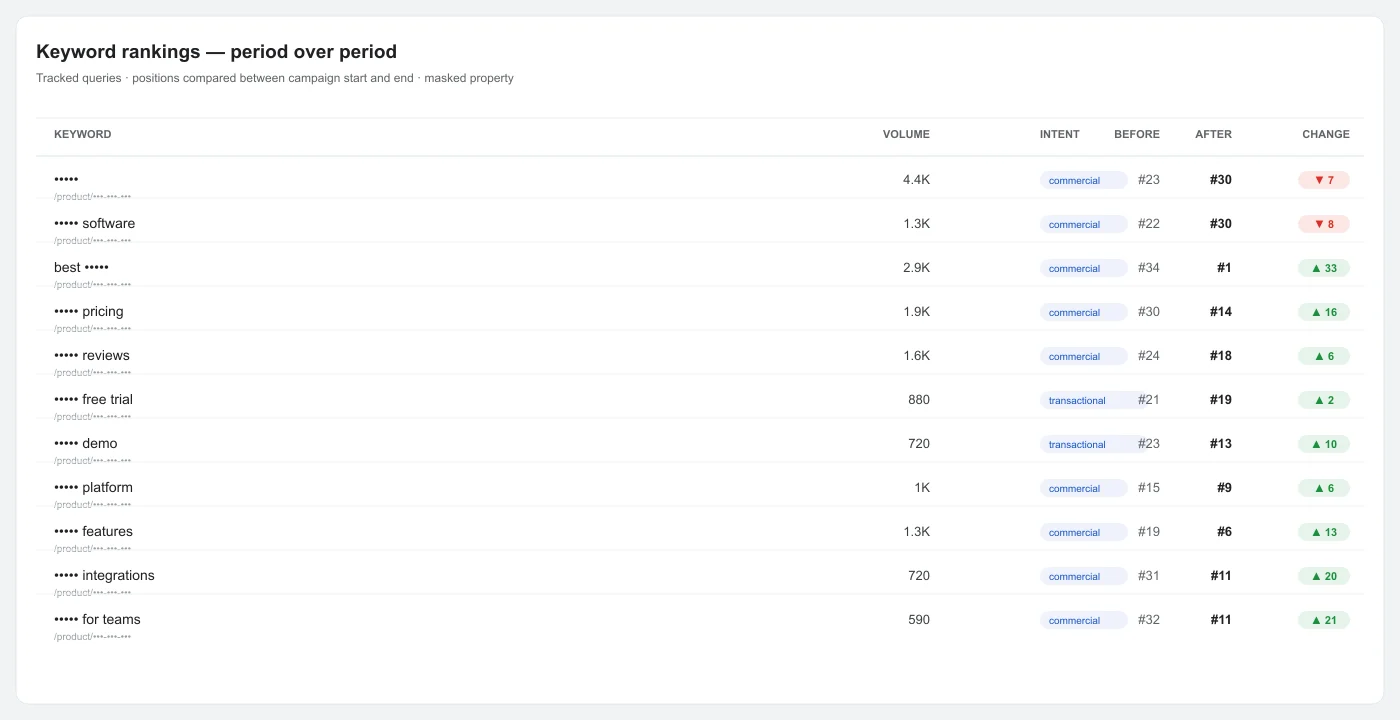
The keyword table is best read as an intent map for the consolidated product page. It shows where modifier intent improved, where the broad head term weakened, and which queries remained unresolved.
Query structure
Intent
Volume
KD
Before
After
Change
•••
Commercial (head)
4,400
52
23
30
-7
••• software
Commercial (head variant)
1,300
48
22
30
-8
best •••
Commercial (buying comparison)
2,900
55
34
1
+33
••• pricing
Commercial (cost research)
1,900
42
30
14
+16
••• reviews
Commercial (validation)
1,600
38
24
18
+6 (volatile)
••• free trial
Transactional
880
35
21
19
+2
••• demo
Transactional
720
33
23
13
+10
••• platform
Commercial
1,000
50
15
9
+6
••• features
Commercial (capability research)
1,300
40
19
6
+13
••• integrations
Commercial (fit research)
720
36
31
11
+20
••• for teams
Commercial (segment fit)
590
32
32
11
+21 (volatile)
••• alternatives
Commercial (switching)
1,300
28
23
10
+13
••• comparison
Commercial (shortlisting)
1,000
31
35
18
+17
••• API
Commercial (developer)
590
44
35
33
+2 (deprioritized)
••• automation
Commercial (use case)
590
39
26
8
+18
••• guide
Informational
480
25
18
16
+2
What the upward movements suggest
The buying-comparison query moved from 34 to 1 while the recorded difficulty was 55. That is a notable end-state snapshot, but the safer interpretation is that the consolidated page became more aligned with shortlisting intent while relevant cluster support accumulated; the case cannot prove that either factor alone produced the rank.
The strongest modifier movements included integration research at 20 places, team-fit intent at 21, automation at 18, and capability research at 13. Those are the exact intent areas where the content library was deepest, which makes cluster coverage a reasonable factor to inspect.
What remained weak or intentionally deprioritized
The head term moved to 30, while the API query moved from 35 to 33. The validation query moved from 24 to 18 but remained volatile, and the trial query moved from 21 to 19. These are not failures to hide; they identify where the current asset type did not fully match the intent or where the program deliberately chose not to build a specialized destination.
Business Impact
Qualified conversions moved from 2 to 7 per month. Using the client's modeled value of 300 per qualified action, the scenario ends at 2,100 in monthly modeled contribution against 600 at the start.
The more important shift is intent quality. Demo intent ended at 18 places improved to position 6, capability research ended at 13, and switching intent at 6 to 10 within the recorded sequence. Those movements suggest a larger share of visitors were arriving with a more defined buying question; quantifying lead quality precisely would take closed-won CRM data, which the tracking did not include.
Why the support library matters
The library reached 92 articles across 10 clusters and recorded 3,736 informational keywords. Its business value is not that every article converts directly. It is that useful research content can create more qualified entry points, provide navigable routes to the product, and support the product page with relevant internal context.
AI answer surfaces
The case also included entity cleanup and self-contained summary passages. For current Google AI Overviews and other AI features, the responsible claim is limited: the 92-article library is structured clearly, but AI citation share was not measured and no special markup is required.
Sales enablement
Approved articles were also reused during prospect evaluation. That is a meaningful secondary use because claim-reviewed content can support sales conversations even when the analytics model does not assign it a direct conversion.
Limitations
The final ranking snapshot includes a buying-comparison result at position 1 with difficulty 55. A single year does not establish that the result will remain stable through competitor changes or broader search updates.
Modeled value uses 300 per qualified conversion, while the final month records 7 conversions. Closed-won CRM data was not tracked, so actual account value by segment is unknown and small monthly samples remain volatile; replace the per-action value with your own average contract value when planning.
Attribution is also mixed. Cluster publishing and link work overlapped from months 2 through 4 and into the later period, so the inflection cannot be cleanly separated into one cause. A full year also gives only 1 annual cycle, which is not enough to isolate seasonality across months 10 to 12.
Three intent gaps remain relevant. The trial query moved only 6 places in the scenario's broader recorded context, and its constraint may lie beyond page copy. The developer query still lacked the specialized documentation surface it wanted, and validation intent remained sensitive to third-party review results.
How to Read the Sequence
The useful interpretation is a chain of plausible mechanisms supported by timing, not proof that one tactic independently caused the final numbers.
Consolidation reduced commercial ambiguity. Average position moved from 25.2 to 22.4 during the early consolidation stage while the product page became the clearer owner for modifier intent.
Support coverage expanded. The internal topical authority index moved from 17 to 38, while the informational footprint reached 3,736. Those are scenario indicators of topic coverage, not official Google metrics.
Modifier intent improved unevenly. Some of the strongest recorded movements were 20, 21, 18, and 13 places on integration, segment-fit, automation, and capability queries. The broad head term did not share the same direction.
CTR improved while query mix changed. The recorded CTR moved from 0.6% to 1.0%, while the product page increasingly appeared for queries where a vendor result matched the searcher's decision stage.
Commercial intent also shifted. Demo intent ended at 13 and switching intent at 10 in the recorded comparison.
Qualified actions increased across the later sequence. The conversion run moved through 2, 3, 4, 5, 6, and 7, with modeled monthly value moving from 600 to 2,100.
External authority moved at the same time: DR from 18 to 30 and referring domains from 23 to 57. Those concurrent changes prevent a precise causal split between content, internal architecture, and links.
Decision Takeaways
Document the query trade before it becomes a surprise. The recorded head-term loss of 7 positions was an explicit choice, not a hidden post-hoc explanation.
Use flat periods diagnostically. A month with clicks at 150 versus 148 and average position at 24.0 triggered the decision to stop adding overlapping commercial pages.
Prioritize depth where buyer intent is commercially useful. The strongest modifier improvements were concentrated in the areas with the clearest cluster support, with gains ranging from 13 to 21 places.
Constraints can improve architecture. Limited production and strict claims review made consolidation more valuable than uncontrolled page proliferation.
Judge the final quarter on qualified actions, not impressions alone. Falling impression volume can coexist with better clicks and conversions when the query mix becomes more relevant.
Related service
See the strategy behind this result.
Explore the SEO strategy for app developer businesses.
Why not build a dedicated comparison page for the broad head term?›
Legal and product-review constraints limited direct named-competitor comparison, while the broad result set often favored directories and roundups. A vendor should build a dedicated comparison asset only if it can serve the intent honestly and maintain the evidence it requires. In this case, the team chose modifier and shortlisting intent instead.
When did the supporting content begin to coincide with visible ranking movement?›
The library reached 32 cumulative pieces before the stronger inflection. Later, impressions moved from 24,382 to 29,039 while average position reached 20.5. The timing is useful as an observation, but it should not be treated as a universal content-lag formula.
Were 92 articles necessary for the result?›
The case cannot prove the counterfactual. What it does show is that the best modifier gains were concentrated in the deepest clusters, with improvements ranging from 13 to 21 places. The practical lesson is to cover buyer questions deeply enough to support the product page rather than chase an arbitrary article quota.
How should the link contribution be interpreted?›
As a concurrent supporting factor. Referring domains moved from 23 to 57 and DR from 18 to 30 while content, consolidation, and internal linking were also changing. The dataset does not support assigning a precise percentage of the outcome to links.
What happens if the content program stops?›
The technical and consolidation work should not disappear immediately, while published content can continue to attract visibility until competitors, product changes, or stale information erode it. No decay curve was measured in this case, so review rankings and refresh the highest-value pages on a schedule rather than relying on an exact persistence forecast.
Did pruning weak pages reduce visibility?›
The case records impressions moving from 21,364 to 19,887 around the pruning phase. That coincided with retiring weak and overlapping URLs, but one period is not enough to isolate pruning as the only cause. The decision should be judged by whether the remaining pages better serve the intended query set and conversion path.
START A SECURE WORKSPACE
Start with a secure workspace.Build toward your Growth Report.
Secure SMS begins the path. Then confirm your email, create a password, add your workspace context, and complete your Growth Brief. Your Growth Report presents the available evidence and clearly marks what is still missing; Google connections remain optional.
Authority Specialist · Managed SEO
Need a team to carry the work through?
Explore our managed SEO approach, what an engagement covers and the current budget guide. No account is needed to review the service.
When you are ready to share your brief, create your free workspace. The proposed work, price and terms are reviewed before a paid engagement.