Case Study

SaaS Company SEO Case Study: How Clicks Moved From 751 to 8782 in 12 Months

A 12-month record of technical cleanup, page consolidation, supporting content, internal linking, and cautious authority work for a SaaS company.

Which decisions matter most in this SaaS company SEO case study?

  1. Evidence basis: Masked illustrative case study generated from coherent synthetic metrics; private client identifiers are not represented.
  2. The recorded SaaS company SEO trajectory moved from 751 to 8782 organic clicks across 12 months, but the page is best used as a sequencing example rather than a promise of repeatable growth.
  3. Average position moved from 20 to 4 while CTR moved from 0.9% to 3.1%, so ranking-stage and click-stage progress should be interpreted together.
  4. Recorded conversions moved from 11 to 147, while modeled monthly value moved from 3,300 to 44,100; the value figure is scenario modeling, not audited revenue.
  5. The program combined technical cleanup, content and intent work, internal linking, entity and schema cleanup, digital PR support, and editorial QA.
  6. The operating constraints were competitive commercial searches, limited publishing capacity, and a requirement to keep claims inside the available evidence.
  7. Use the case study to decide what to consolidate first, where supporting content belongs, and which measurements should remain distinct.

Case Study at a Glance

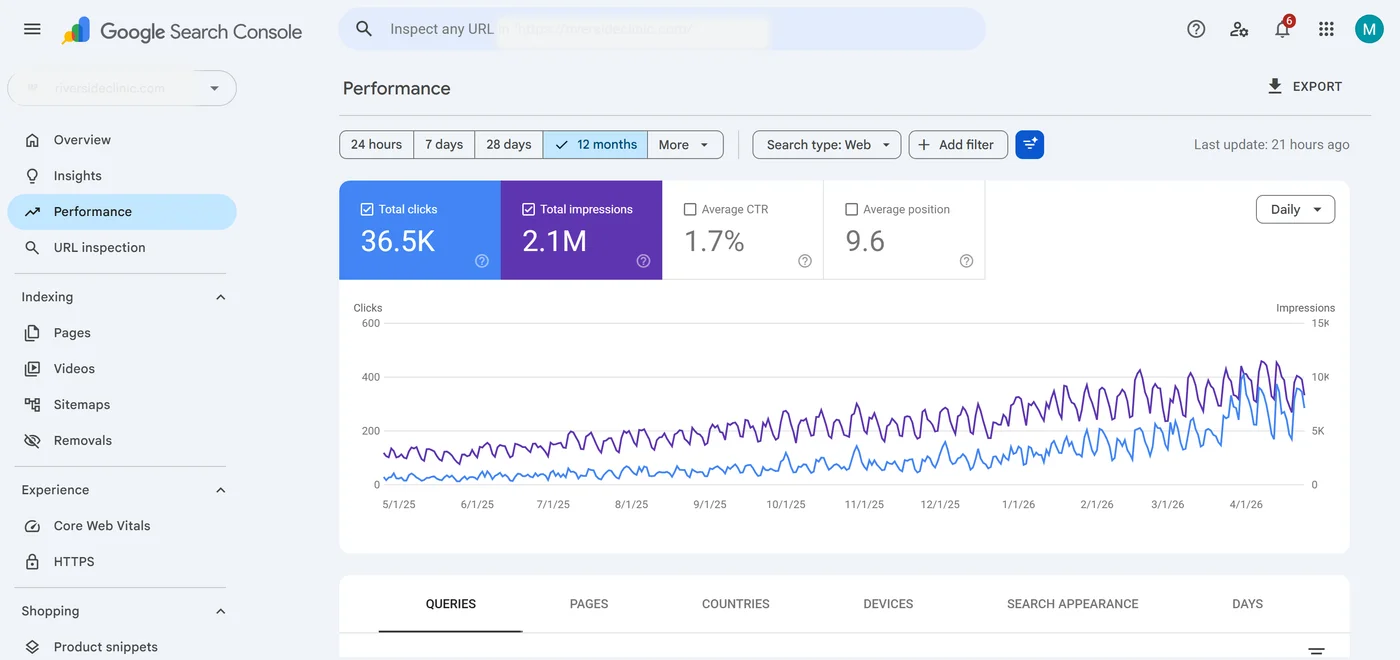
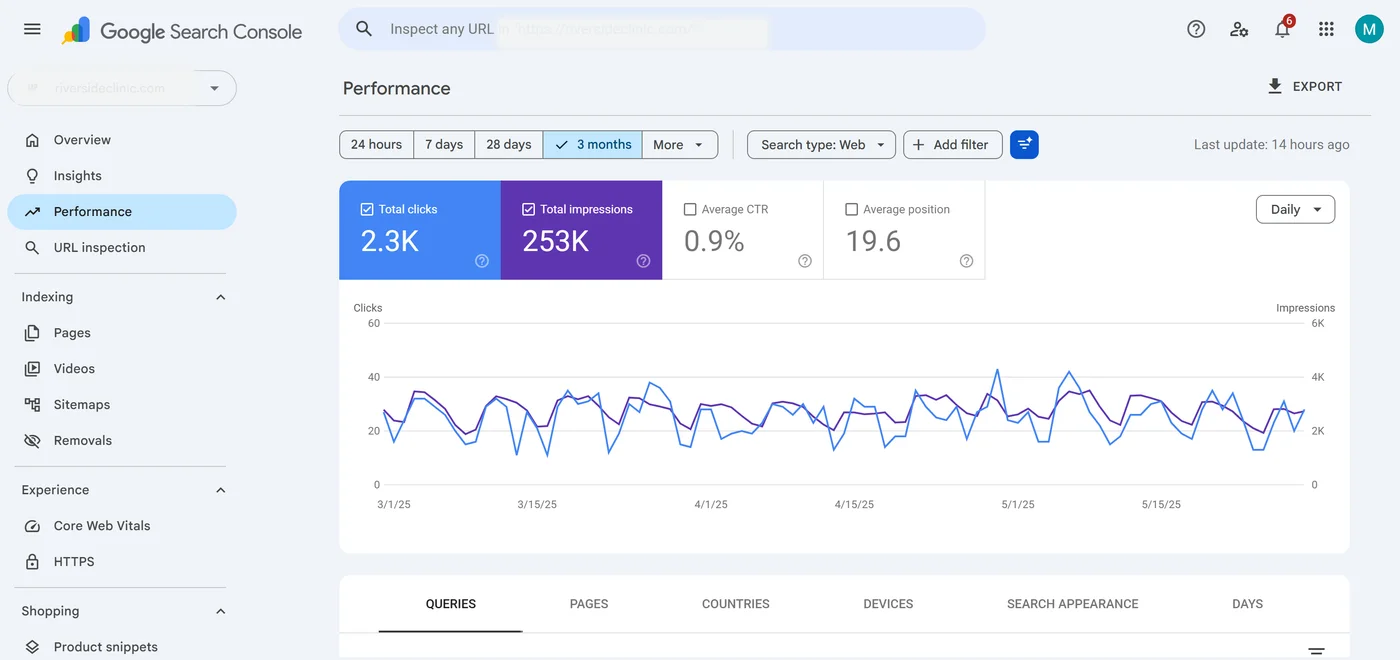
The supplied baseline shows an average position of 19.6, 751 clicks from 83,409 impressions, and 11 conversions with about 3,300 in modeled monthly value. By the end of the observed window, the same masked scenario records average position 4, 8,782 clicks from 283,303 impressions, and 147 conversions with modeled monthly value of 44,100.

The decision-useful lesson is not a single growth claim. It is the order of work: remove indexation waste, decide which commercial pages should survive, build a useful informational layer, and direct that supporting relevance toward the pages intended to generate trials or demos. Multiple workstreams overlapped, so the movements should be read as a coordinated case-study pattern rather than proof that one tactic caused the result.

For a decision maker, that sequence creates a simple diagnostic order. First ask whether search engines are seeing the intended pages. Then ask whether overlapping URLs are splitting the same intent. Only after those questions are settled does it make sense to judge whether the site lacks supporting content, internal pathways, or external authority.

Starting Point

The starting point

The client is represented as a SaaS company competing nationally for commercial technology searches. The site had grown without a consistent information architecture, so average positions sat around 20, non-branded traffic was uneven, and the commercial pages lacked a strong supporting layer.

The supplied authority context was Domain Rating 13, 23 referring domains, and 134 total backlinks. That profile matters as context, but it does not isolate the effect of links from the other changes made during the year.

The operating constraints were straightforward: competition was real, content capacity was finite, and every public claim had to stay inside what the client could substantiate. Those constraints favored prioritization over volume and made page purpose, internal linking, and editorial review central to the plan.

The buyer journey also matters. SaaS prospects rarely move from a generic category query straight to a purchase decision. They compare alternatives, evaluate integrations, review security and implementation requirements, and estimate total ownership cost. The site needed a structure that could support those questions without creating a new commercial landing page for every variation.

What Needed Fixing

Where the site was losing clarity

The first crawl showed overlapping commercial pages competing for the same primary category intent. The head term was recorded at position 25 with 22,000 monthly searches behind it, while the surrounding architecture gave search engines several plausible URLs instead of one clear commercial destination.

Three supporting issues made that overlap harder to resolve:

  • Crawl waste. Filtered views and parameter pages created low-value URLs that diluted the site's index.
  • Weak internal paths. Conversion pages sat deeper in the click path than they needed to, with too few contextual links from relevant content.
  • Thin topical coverage. The site had little informational depth around implementation, integrations, pricing, security, migration, reporting, and evaluation questions.

The practical decision was to stop treating publishing volume as the first answer. Architecture had to become clearer before more pages were added.

That diagnosis turns the challenge into a set of choices rather than a checklist. Pages with the same purpose should not compete indefinitely. Thin filter or parameter URLs should not absorb attention merely because the platform can generate them. And informational content should be commissioned because it resolves a real research question and connects naturally to the product evaluation path.

What Changed

How the work was sequenced

The engagement combined six workstreams, but the important part was the dependency between them: technical and architectural changes came before the bulk of the supporting content.

1. Technical SEO and indexation cleanup, months 1 to 3

Crawl and indexation triage came first. Canonicals and redirects were reviewed, template duplication was reduced, and Core Web Vitals and renderability were checked. The goal was to reduce low-value URL noise and make sure the pages chosen to carry commercial intent were the pages the site referenced consistently. At month 1, checks across 3 priority templates were used to confirm that the intended destinations were the ones being exposed consistently. Across the first part of the window, average position moved from 19.6 to 14.8, but that movement should be treated as an observation during a period with several simultaneous changes.

2. Information architecture and internal linking, months 2, 3, 5

Commercial pages competing for the same intent were compared, consolidated where appropriate, and redirected toward the surviving destination. Internal links were then updated so supporting pages pointed directly to that primary URL instead of through outdated or duplicate paths.

3. Authority content and intent alignment, months 2 to 4

Target queries were grouped by buyer intent, commercial pages were checked against the result types they needed to satisfy, and support-page topics were chosen around real research questions rather than a raw keyword count.

4. Building the topical support library

The content program ultimately reached 135 articles across 10 topic clusters. The library covered implementation and onboarding, integrations and API use, pricing and total cost of ownership, security and compliance, comparisons and evaluation, migration, admin and team management, reporting and analytics, industry use cases, and buyer education. By month 12, the scenario records roughly 5,616 informational keywords.

The useful mechanism is architectural rather than mystical. Supporting pages can answer research-stage questions and create meaningful internal paths into commercial pages. The internal topical authority index moved from 23 to 59 during the period, but that is an internal measure rather than an official Google ranking metric.

5. Entity, schema and Google AI-readiness work, months 3 to 5

Existing Organization and Service markup was reviewed, author and reviewer information was aligned, citations were checked, and concise summary passages were added where they could accurately stand alone. For Google AI Overviews and other Google AI features, the case does not imply a special markup requirement or guaranteed inclusion.

6. Digital PR and link recovery, months 4 to 6

Lost links and relevant citations were reviewed, unlinked mentions were prioritized, and outreach focused on placements that fit the business and topic. Referring domains moved from 23 to 59, which is best read as one concurrent authority signal rather than proof of a fixed causal effect.

Brand Voice and editorial QA, months 1, 2, 4

Approved page language was sampled to define tone and claim boundaries, then a reviewer checklist was used before publication. This kept the full library of 135 articles inside the evidence the client had approved.

Data sources

The supplied scenario uses Search Console for impressions, clicks, CTR and position, analytics for sessions and conversions, and a third-party authority tool for link and visibility context. Modeled value is not exact CRM attribution.

For a SaaS team deciding whether to copy this sequence, the practical test is page ownership. Every commercial intent should have a defensible primary destination, every supporting page should have a reader reason to exist, and every internal link should make navigation clearer. If those conditions are not true, adding more content increases maintenance without necessarily improving the architecture.

The commercial-page review should also distinguish product evaluation from support education. Pricing, implementation, security, migration, and integrations can each support a buying decision, but that does not mean every variation needs its own sales page. A separate destination is justified when the user need, page purpose, and available evidence are meaningfully different. Otherwise, consolidation plus clear subsections can be easier to maintain and easier for a prospect to navigate.

Editorial planning followed the same rule. A support topic had to answer a real question, fit a defined cluster, and have a sensible next step for the reader. This keeps the library from becoming a collection of isolated keyword pages and makes internal linking an editorial decision rather than an afterthought.

Recorded Timeline

Phase by phase

Months 1 to 3: foundation. Clicks moved from 751 to 1,179 while average position moved from 19.6 to 14.8. Conversions moved from 11 to 17. The important milestone in this phase was not explosive growth but a cleaner set of commercial targets after technical and architectural changes.

Months 4 to 5: content and reinforcement. Clicks reached 1,675 by month 5, average position reached 12.9, and conversions moved from 21 to 28. Effort shifted toward reinforcing pages already showing qualified demand instead of maximizing raw output.

Months 6 to 8: broader authority signals. Average position moved from 11.8 to 8.5, while clicks moved from 2,133 to 2,839. The internal authority index passed 46, and month 8 recorded 51 conversions. These movements happened while content, internal linking, and authority work overlapped, so the case does not isolate a single cause.

Months 9 to 12: stronger commercial visibility. Impressions crossed 219,000 and then 283,000, while CTR moved from 1.7% to 3.1%. Clicks were recorded at 3,730, 4,577, 5,796, and 8,782. The period ended with 147 conversions and modeled monthly value of 44,100. The source notes the sharpest movement between month 11 and month 12; that timing is specific to this scenario rather than a standard SEO timetable.

The timeline also shows why reporting stages should be named by the job being done. Foundation work is judged by cleaner ownership and indexation. Expansion work is judged by useful coverage and internal pathways. Later commercial visibility is judged by whether the right query families, not merely more queries, are reaching positions that can produce qualified visits.

Results and Evidence

What the annual record shows

Across 12 months, the before-and-after Search Console views are most useful as directional evidence of how visibility, average position, and click behavior changed over the supplied period.

Saas Company SEO baseline search performance

The baseline average position was 19.6 with a 0.9% CTR. That is consistent with a site collecting impressions while many listings still sit outside the positions most likely to earn clicks.

Saas Company SEO end-state search performance

By month 12, the scenario records average position 4, CTR 3.1%, 8,782 clicks, and 283,303 impressions. Those figures are internally coherent within the masked scenario but should not be represented as independently verified third-party exports.

Headline movement over the observed window:

  • Clicks: 751 to 8,782 per month
  • Impressions: 83,409 to 283,303 per month
  • Average position: 19.6 to 4
  • Conversions: 11 to 147 per month
  • Modeled monthly value: 3,300 to 44,100
  • Domain Rating: 13 to 24; referring domains: 23 to 59

The result set also illustrates why averages need context. A stronger sitewide average can hide individual query losses, and a higher CTR can reflect a different query mix as well as better positions. For decisions, the commercial query groups, conversion actions, and page ownership changes should be reviewed together rather than compressed into one headline metric.

Keyword Movement

Which intents moved and which did not

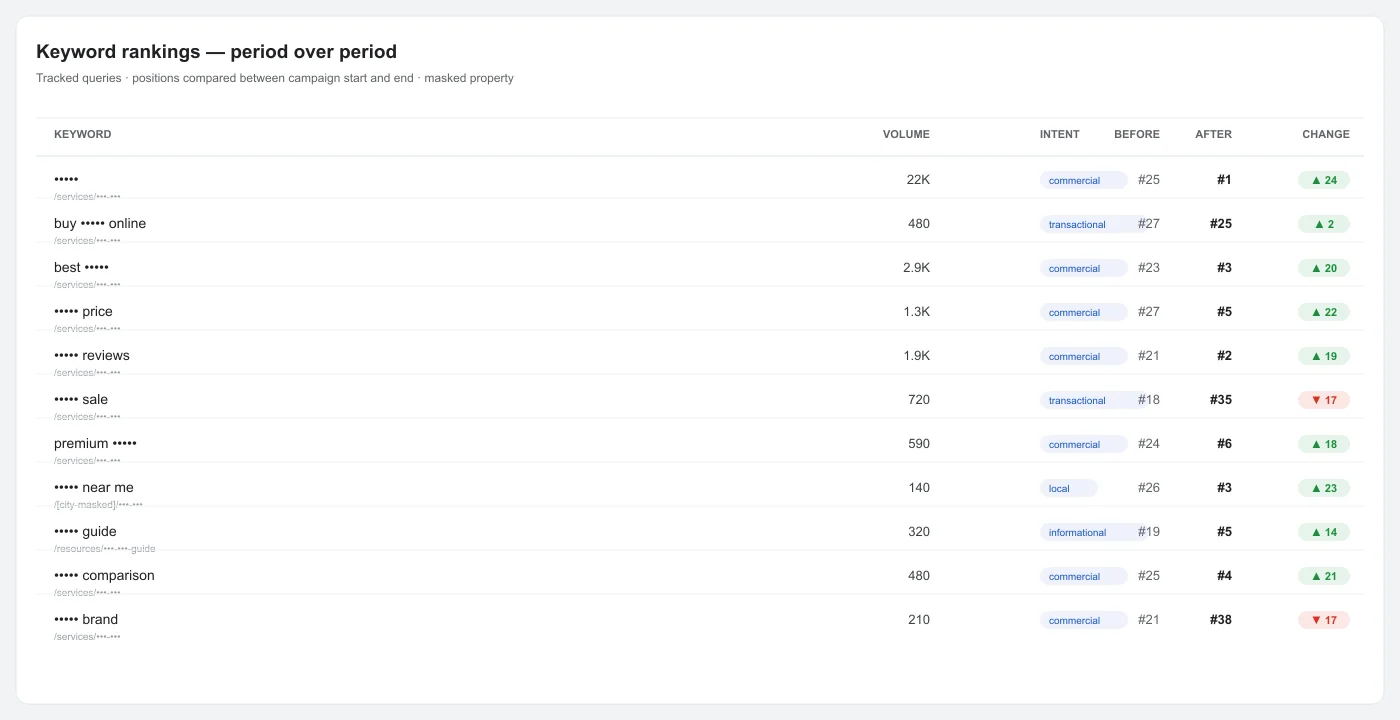
The primary head term carried recorded demand of 22,000 and moved from position 25 to 1. Other commercial evaluation terms also improved, while a transactional 'sale' intent moved from 18 to 35, a brand-oriented term from 21 to 38, and a low-volume shipping-style query from 12 to 34. The safest interpretation is that consolidation and changing page ownership benefited some query families while others lost the landing page that had previously served them.

Saas Company SEO rankings comparison
Query structureIntentVolumeBeforeAfterStatus
[masked]commercial22,000251winner
best [masked]commercial2,900233winner
[masked] reviewscommercial1,900212winner
[masked] pricecommercial1,300275winner
[masked] saletransactional7201835decliner
premium [masked]commercial590246volatile
buy [masked] onlinetransactional4802725stable
[masked] comparisoncommercial480254winner
custom [masked]commercial390232winner
[masked] guideinformational320195winner
[masked] financingcommercial210144winner
[masked] brandcommercial2102138decliner
[masked] storecommercial170224winner
[masked] warrantycommercial140296winner
[masked] near melocal140263winner
[masked] shippingcommercial1101234volatile

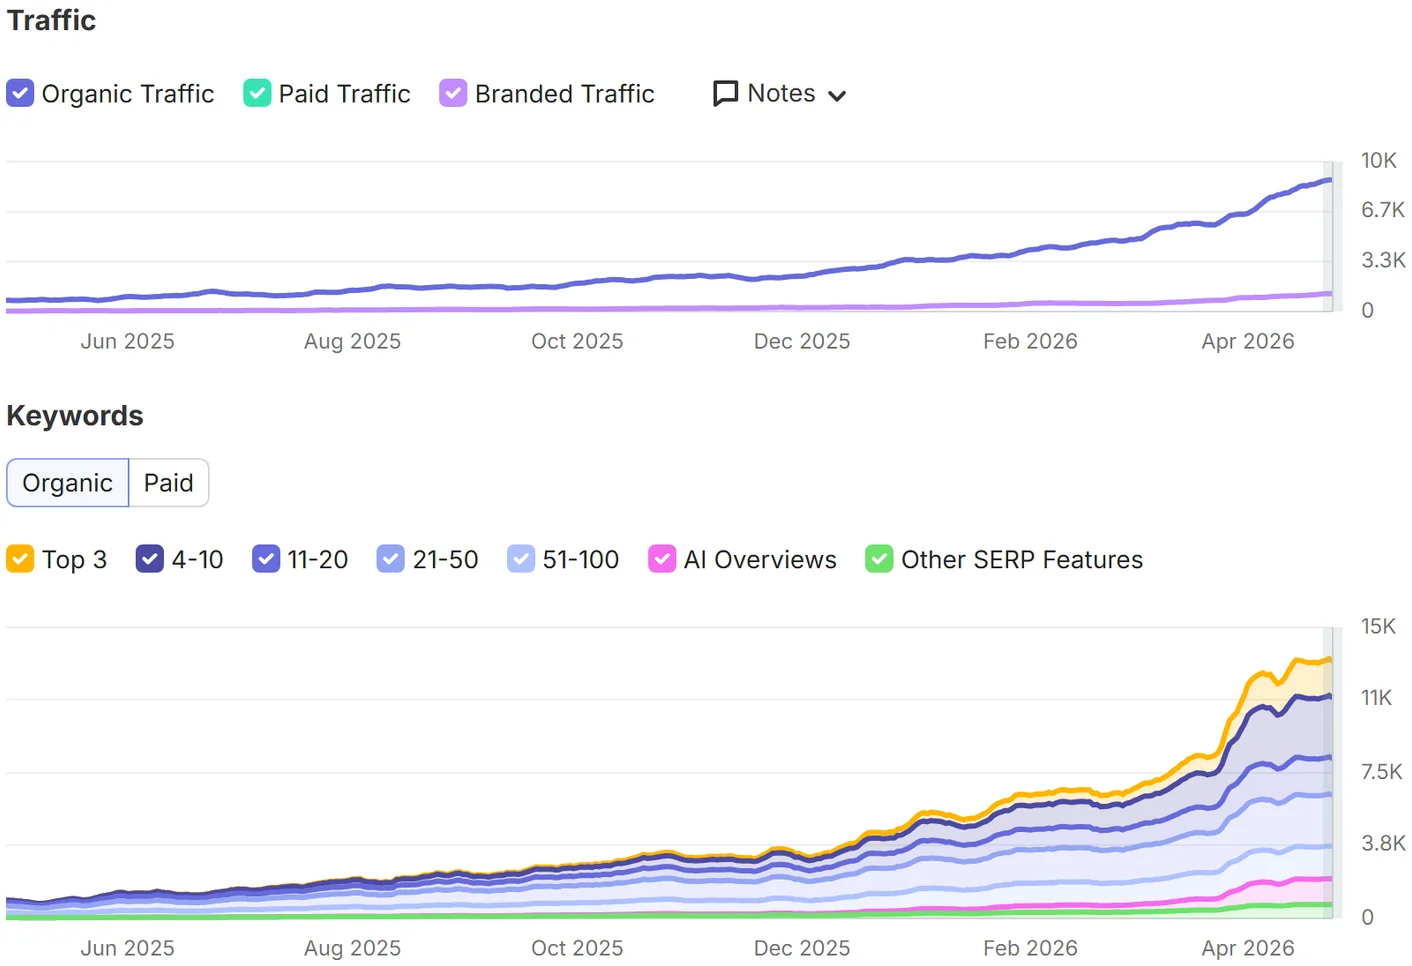
The third-party visibility view below should be read as a directional cross-check, not a replacement for first-party search data.

Saas Company SEO screenshot

The informational guide query is one example inside a wider footprint that ended near 5,616 informational keywords. That breadth is useful as evidence of wider topic coverage, not as proof that article count mechanically caused the commercial rankings.

For another SaaS company, the table is a reminder to classify intent before choosing a page type. A query that asks for a category comparison, a branded evaluation, a transaction, or a local-style result may not deserve the same destination. The correct response to a declining keyword can be to restore a page, improve the surviving page, create a genuinely different asset, or deliberately leave the query deprioritized.

The masked local-style and retail-style query structures in the supplied table should not be treated as a recommendation to create pages that misrepresent how a SaaS company operates. A dedicated location page is appropriate only when the company has a genuine location or location-specific offering with useful information. Likewise, a store-style or shipping-style query should be evaluated for fit before resources are committed to it.

Declining queries deserve the same scrutiny as winners. If a dedicated page was removed because it duplicated a stronger commercial destination, a lower ranking may be an accepted cost. If the query represents distinct, valuable intent that the surviving page cannot satisfy, the decline may instead reveal a missing asset. The table is therefore a prioritization input, not a scorecard where every row must turn green.

Business Impact

What the scenario means commercially

The recorded conversion line moved from 11 to 147 per month, while modeled monthly value moved from 3,300 to 44,100. Those values belong to the supplied scenario and should be treated as modeled business impact rather than audited closed-won revenue.

The support library reached 135 articles across 10 clusters. Its practical value is that it gave prospects useful research-stage pages on implementation, integrations, pricing, security, migration, administration, analytics, and evaluation, while also creating internal routes into commercial pages. That makes the library an owned content asset, but it still requires maintenance as product details and market conditions change.

For Google AI Overviews and other AI features, the cautious takeaway is about clarity rather than a special ranking shortcut. Consistent entities, evidence-bounded summaries, and topic depth can make content easier to interpret, but this case contains no measured AI citation count and supports no guaranteed AI visibility claim.

The editorial QA work also matters commercially because claims, author information, and page evidence stayed aligned. That helps a SaaS company use the same educational content across research and sales conversations without introducing unsupported capability promises.

That distinction matters for budgeting. Informational content can support discovery and evaluation without being credited as direct revenue on every visit. Commercial pages can convert better without explaining the entire category. The architecture works when each layer does its own job and the measurement model does not force every page into the same conversion expectation.

For leadership, the key reporting question is whether organic search is improving the quality and quantity of product evaluation opportunities. That requires keeping modeled value separate from audited revenue, keeping informational visibility separate from direct conversion credit, and asking sales or product teams whether the pages attracting prospects answer the questions that actually appear during evaluation.

The owned-content advantage is durability, not permanence. Well-maintained pages can continue attracting search demand without paying for every visit, but integrations change, security expectations evolve, pricing changes, and competitors publish. A useful SaaS content library therefore needs maintenance plans, not a claim that rankings will simply persist on their own.

Limitations

Where the record is noisy

The keyword picture was not uniformly positive. The supplied dataset includes two decliners and a volatile query, which is why the case should not be summarized as every intent moving upward.

  • Consolidation trade-offs. Two secondary query families weakened after their dedicated pages were removed or absorbed.
  • Volatility. The low-volume shipping-style query remained unstable and does not justify a broad strategic conclusion.
  • Attribution limits. Modeled value is not CRM-verified revenue, and several SEO workstreams overlapped.
  • Link plateaus. Referring domains were flat between months 7 and 8 at 44, which is simply one observation in the larger authority trend.

The scenario is masked and illustrative, so it is most useful for understanding prioritization and trade-offs rather than for claiming externally verified client performance.

Other limits are structural rather than statistical. The client is masked, the metrics are synthetic and internally coherent, and no independent source URL is supplied for third-party verification. That means the case can support a workflow discussion and an evidence-bounded interpretation, but not a public claim that these are audited results from an identifiable company.

The case also cannot separate the contribution of content changes, internal linking, redirects, entity cleanup, and external authority work with experimental precision. Those activities overlap in the timeline. Where the page describes a plausible mechanism, it should be read as an interpretation consistent with the sequence rather than a controlled causal finding.

Finally, average position and sitewide CTR can conceal important differences between query groups. Commercial, informational, branded, and unusual query structures can behave differently even when the overall trend improves. Decisions should be made at the page and intent level when the available data allows it.

How to Read the Sequence

A cautious mechanism, not a proof claim

The sequence provides a set of plausible mechanisms that fit the recorded data.

Structure first. Average position moved from 19.6 to 14.8 during the opening phase while technical cleanup and consolidation were active. That timing makes architecture relevant, but other work was happening too.

Coverage expanded. The library reached 135 articles across 10 clusters, while the internal topical authority index moved from 23 to 59 and the site recorded about 5,616 informational keywords. Those are coverage indicators, not official ranking-factor measurements.

Internal links connected research and commercial pages. That created a clearer site structure for both users and crawlers, without guaranteeing a specific ranking outcome.

More visible rankings coincided with higher CTR. CTR moved from 0.9% to 3.1% while clicks moved from 751 to 8,782. Query mix and SERP presentation can also affect clicks, so the relationship should remain observational.

Lead outcomes also changed. Conversions moved from 11 to 147 over the same broader period. The evidence does not isolate one workstream as the sole cause.

The practical conclusion is about dependency: clarify which commercial pages should own which intents, build useful supporting content, connect those pages clearly, and evaluate search and business metrics together.

A team using this case as a planning reference should therefore separate observations from decisions. The observations describe what moved. The decisions describe why a page was merged, why a topic deserved supporting coverage, and why a link or schema change was made. That distinction makes the case transferable without pretending the outcome is transferable.

Decision Takeaways

What another SaaS team can carry forward

  • Resolve overlapping commercial intent before scaling support. The head term in this scenario moved from 25 to 1, but the useful lesson is the clarity created by one primary destination, not a guaranteed ranking result.
  • Build support around buyer questions. The program reached 135 articles across 10 clusters, but depth and coherence matter more than a universal publishing quota.
  • Sequence technical, architecture, content, and authority work. That keeps each investment attached to a clear site problem instead of treating every tactic as interchangeable.
  • Keep losses visible. Consolidation can strengthen one query family while weakening another, and those trade-offs should be documented rather than hidden.
  • Keep AI claims evidence-bound. Clear entities and concise summaries can improve interpretability, but this case does not measure or guarantee citation in Google AI Overviews or other AI systems.
  • Respect the starting authority context. The supplied baseline included DR 13, so another site should assess its own competition and authority rather than borrow the same priorities blindly.

The strongest takeaway is not a content quota or a fixed schedule. It is the discipline of giving each page a job, removing conflicts before expanding the library, and checking whether search visibility is producing the commercial actions the SaaS business actually values.

A practical review cadence should therefore ask whether page ownership is still clear, whether support topics remain accurate, whether internal links still point to the best destination, and whether commercial query groups are producing the actions the business values. Those checks are more durable than copying a publishing volume or treating any one authority metric as a target.

Related service
See the strategy behind this result.
Explore the SEO strategy for saas company businesses.
Saas Company SEO services

Frequently Asked Questions

Why was content scale delayed until after the technical and architecture work?

The site had overlapping commercial pages and low-value crawl paths. Publishing more before resolving those issues could have added more URLs without clarifying which page should own each intent. In the supplied sequence, average position moved from 19.6 to 14.8 before the bulk of the support library was in place. That timing is specific to this case study, not a standard SEO timetable.

How should the topical authority movement be interpreted?

As an internal coverage signal rather than an official Google metric. The internal topical authority index moved from 23 to 59 while the supporting library expanded and internal links connected those pages to commercial destinations. The dataset does not prove that this metric itself caused rankings.

Is the modeled revenue figure exact?

No. It is a modeled monthly value in the supplied scenario, not exact CRM attribution. Search visibility, click, and position data should be interpreted separately from modeled business value.

Why did some query families lose rankings?

Consolidation changed which pages were allowed to own certain intents. A few secondary queries lost the dedicated landing pages that had previously served them, while the surviving commercial page was prioritized for broader and more valuable intent groups. That is a trade-off, not evidence that every keyword should improve together.

Does the case study prove the rankings will persist?

No. Owned content and clearer architecture can keep attracting organic visibility after publication, but rankings still change as competitors, SERPs, product details, and search systems evolve. Ongoing maintenance is still required.

THIRTY SECONDS TO START

You've read enough.Your own data says more.

Connect your site and see it yourself: your rankings, your gaps, your blockers, and what AI tells your buyers. The plan and the priced options follow within 36 hours.

Your access code by SMS. We never call.No payment